Editor’s note: this guide combines what were originally two posts — Part I (the fundamentals of Ruby heap dumps) and Part II (taking and analyzing a heap dump in production).
In my last post, we looked at how you can dig into memory “leaks” on Heroku. These techniques all work well if you can reproduce the memory bloat locally. When you can’t, we can take a “heap dump” off of a running production server and analyze it for more information.
In this guide, we’ll look at the basics of what a heap dump is, what the contents look like, how to analyze one, and how to take a heap dump in production. Feel free to skip a section if you’re already familiar with the concepts.
What Is a Heap Dump?
A heap dump is a file that contains a representation of every Ruby object in memory. To generate one, we need to first tell MRI to trace object allocations:
LANG:ruby
require 'objspace'
ObjectSpace.trace_object_allocations_start
Note: All Ruby examples in this post are 2.2.3
Once you’ve done this, you can generate a file that contains newline-separated JSON objects where each object represents a Ruby object that was allocated. To generate this heap dump file, you can run the following:
LANG:ruby
file = File.open("/tmp/heap.dump", 'w')
ObjectSpace.dump_all(output: file)
file.close
Note: It is important to always close the heap dump file after writing to it. Otherwise the last line of the file may be mangled, making it impossible for an analysis tool to parse.
What’s Inside a Heap Dump?
Once you take a heap dump, you can inspect all the objects that have ever been in Ruby’s memory.
LANG:bash
$ cat /tmp/heap.dump
{"address":"0x7f9539028188", "type":"STRING", "class":"0x7f95390e0ee0", "frozen":true, "embedded":true, "fstring":true, "bytesize":9, "value":"target_os", "encoding":"UTF-8", "memsize":40, "flags":{"wb_protected":true, "old":true, "long_lived":true, "marked":true}}
{"address":"0x7f95390281d8", "type":"STRING", "class":"0x7f95390e0ee0", "embedded":true, "bytesize":7, "value":"245_foo", "encoding":"US-ASCII", "file":"scratch.rb", "line":9, "generation":4, "memsize":40, "flags":{"wb_protected":true, "old":true, "long_lived":true, "marked":true}}
Manually inspecting this file might be of some interest, but we really need to aggregate information to make use of this data. Before we do that, let’s look at some of the keys in the generated JSON.
- generation: The garbage collection generation where the object was generated
- file: The file where the object was generated
- line: The line number where the object was generated
- address: This is the memory address of the object
- memsize: The amount of memory the object consumes
- references: The memory addresses of other objects that this object retains
There are other keys, but that’s enough for now. It’s worth noting that several of these are optional. For example if an object was generated before you started tracing object allocations, it won’t contain generation, file, or line information.
From Dump to Data
Before we can do anything interesting with a heap dump, we’ll need a way to analyze the data. For that, I wrote a barebones CLI called heapy. To understand how to use this tool, we’ll install it, generate a very simple heap dump, and analyze it.
First, let’s install the tool:
$ gem install heapy
Now we need to generate some objects and dump them to disk. To do this, you can run this script:
LANG:ruby
require 'objspace'
ObjectSpace.trace_object_allocations_start
count = (ARGV.first || 5_000 ).to_i
ARRAY = []
count.times do |x|
  a = "#{x}_foo"
  ARRAY << a
end
file_name = "/tmp/#{Time.now.to_f}-heap.dump"
file = File.open(file_name, 'w')
ObjectSpace.dump_all(output: file)
file.close
puts "heapy read #{file_name}"
In this script, we are looping to allocate strings and storing them to a constant that will never be garbage collected. This is a simulation of a very basic memory leak.
I recommend you save this script to disk. I stored mine at /tmp/scratch.rb and executed it via $ ruby /tmp/scratch.rb. If you try to run it in IRB or another interactive Ruby shell, you’ll get a lot of junk objects since the shell requires objects to function.
LANG:bash
$ ruby /tmp/scratch.rb
heapy read /tmp/1446224175.392672-heap.dump
Now we can run that command to get a basic count of objects per generation:
LANG:bash
$ heapy read /tmp/1446224175.392672-heap.dump
Analyzing Heap
==============
Generation: nil object count: 7401
Generation:   5 object count: 20008
Congrats! You just analyzed your first heap dump. What does this mean? Don’t worry if your numbers don’t line up perfectly. The “nil” generation means these objects were allocated before we enabled allocation tracing.
This output is showing that we allocated 7,401 objects before we began tracing allocations. After this, we allocated 20,008 objects during fifth generation or the fifth time that Ruby’s garbage collector ran a full mark and sweep.
Nil Generation
In the above example, our “nil” generation count was fairly low at 7,401. However, sometimes it can be really high and skew analysis. For example, if we had to use Active Support in our script, and it started with this:
LANG:ruby
require 'rubygems'
require 'active_support'
require 'objspace'
ObjectSpace.trace_object_allocations_start
# Rest of script
Then we would see many more objects allocated before tracing started:
LANG:code
Analyzing Heap
==============
Generation: nil object count: 39503
Generation:  11 object count: 10034
If you need to capture the maximum number of allocations possible, you can put your allocation code in a separate file and execute it before running your script.
$ echo "require 'objspace'; ObjectSpace.trace_object_allocations_start" > trace.rb
Now, run the same command using -I to add the current directory to the load path and -r to require our file before running the script.
LANG:bash
$ ruby -I . -r trace.rb scratch.rb
heapy read /tmp/1447092518.631352-heap.dump
Analyzing Heap
==============
Generation: nil object count: 7389
Generation:   4 object count: 1060
Generation:   5 object count: 7004
Generation:   6 object count: 4544
That’s much nicer. Since our script for this article doesn’t do much work before we start tracing allocations, we won’t use this technique for the sake of simplicity.
Digging into a Generation
Once we see general allocation counts, we can dig into aggregate measures of a generation. To do this, you can pass in a number at the end of the heapy call. For example, this will show detailed information about objects allocated in the fifth generation:
$ heapy read /tmp/1446224175.392672-heap.dump 5
You can also see all results by using “all.”
LANG:bash
$ heapy read /tmp/1446224175.392672-heap.dump all
allocated by memory (858199) (in bytes)
==============================
  767720  scratch.rb:9
   89712  scratch.rb:7
     464  scratch.rb:17
     176  scratch.rb:14
     127  scratch.rb:16
object count (19201)
==============================
  19193  scratch.rb:9
      3  scratch.rb:14
# ... (output truncated for draft)
NOTE: Your output might differ; this library is young and will evolve over time (even as I’m writing this article).
This is more useful information than the first command. We can see the most aggregate allocated memory occurred on line 9. This is also where we’ve allocated the largest number of objects:
a = "#{x}_foo"
It’s also useful to see what object retains the most other objects. In this case, an object is allocated on line 7 and contains references to 10,000 objects. It’s no surprise that this is our array:
ARRAY = []
The important thing to remember is that we record when the object was allocated, not when it was assigned. If I were looking at the script, I would ideally like a red flag on this line:
ARRAY << a
However, there are no objects allocated on this line so it doesn’t show up in our heap dump. We have to infer that this is where the references are getting added by noting where objects are created and what lines reference large numbers of objects.
This means when we’re hunting for memory problems, heap dumps are more of a tool for finding bread crumbs than smoking guns.
Retained or Allocated or Both?
Ruby only includes the objects that have not been garbage collected in a heap dump. When you take a heap dump, you may get different results depending on if a garbage collection just ran or if it hasn’t run in a long time.
If you’re hunting for a memory leak, it won’t matter. You should be able to see allocated objects readily in your heap dumps since they haven’t been cleared.
However, if you’re looking for memory bloat, where lots of objects intermittently are created, you may get a heap dump right after they were cleared via a GC. To get a “clean” heap dump, you could manually force a GC by running GC.start before generating the heap dump. For example, if the script didn’t retain memory but simply created and discarded it:
LANG:ruby
require 'objspace'
ObjectSpace.trace_object_allocations_start
count = (ARGV.first || 5_000 ).to_i
def allocate_objects(count)
  array = []
  count.times do |x|
    a = "#{x}_foo"
    array << a
  end
  return nil
end
allocate_objects(count)
# ... (output truncated for draft)
When we run this, we see that almost no objects are left in the heap.
LANG:bash
$ ruby scratch.rb 20_000
heapy read /tmp/1447433325.440035-heap.dump
Analyzing Heap
==============
Generation: nil object count: 7399
Generation:   5 object count: 1
Generation:   8 object count: 2
Generation:   9 object count: 2
If you take out the GC.start, you’ll get a heap with lots of temporary objects:
LANG:bash
$ ruby scratch.rb 20_000
heapy read /tmp/1447433430.98191-heap.dump
Analyzing Heap
==============
Generation: nil object count: 7399
Generation:   4 object count: 806
Generation:   5 object count: 10917
Generation:   6 object count: 5468
Generation:   7 object count: 1335
Generation:   8 object count: 1482
If you’re not getting enough temporary object information, you could GC.disable for a period of time and then GC.enable after generating a heap dump.
Be careful though; your memory use could skyrocket if you don’t enable quickly. Instead, I would recommend generating multiple heap dumps at different times.
More Objects, More GC
We can run this same script and generate more objects by passing in an argument. As you saw before, we’ll get more generations in our output:
LANG:bash
$ ruby /tmp/scratch 20_000
Analyzing Heap
==============
Generation: nil object count: 7395
Generation:   4 object count: 250
Generation:   5 object count: 11191
Generation:   6 object count: 5605
Generation:   7 object count: 1433
Generation:   8 object count: 1530
What is happening here? Ruby is trying to allocate objects, and it runs out of space. It tries to claim unused objects, however, while the loop is running, it can’t get rid of any of those strings. So, it has to ask the OS for more memory so the program can continue to run. It repeats this process several times.
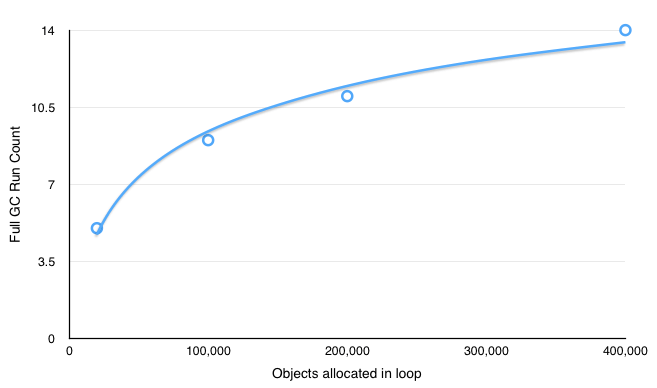
If you continue to increase the number of allocated objects, you can see that the total number of GC runs decreases in relation to object count over time. This is because, every time Ruby asks the OS for more memory, it asks a percentage of its current size. Since the total size is going up, it asks for larger and larger chunks.
Here you can see this relationship between the number of objects allocated and the count of full GC runs graphed:
Taking a Heap Dump in Production
Now that you’ve got a good sense of the type of information included in Ruby heap dumps and how to dig into it, we’ll generate a heap dump off of a Heroku dyno and analyze it.
To begin, you’ll need a production app running on Heroku, an AWS account, and S3 credentials for storing the dump information.
If you don’t have an app you want to debug yet, you can use my open source app codetriage.com.
Heap Dump Concepts on Heroku
Before we get to the code, we need to understand some core features of Heroku. Each dyno is ephemeral, and you can’t modify it while it is running. This is amazing for stability, but can be frustrating when you’re trying to debug a problem that only shows up in production.
The other key point is that tracing object allocations is expensive (slow); writing a heap dump to disk and uploading it to S3 is also expensive. Due to this, we want to only run our tracing code on one dyno, so we’re only slowing down a fraction of our web requests.
If your app has only one running dyno, I would recommend increasing the count while you’re debugging. Otherwise your users might be stuck with long load times or a broken experience. If you’re close to your memory limits, you might also consider upgrading to the next sized dyno. For example, if you’re running on 1x dynos with 512mb of RAM, consider bumping it up to 2x dynos for the duration of your experiments. The tracing and dumping will use some system resources, and you don’t want them to impact your end user.
Generating a heap dump in Ruby will store all retained strings in plain text. This likely includes all sensitive strings such as your service or database credentials. After taking a heap dump off of a production service, be careful who you share the file with.
Running Code on a Select Number of Dynos
To help with isolating your code to only one dyno, I wrote a simple library called the lone dyno. It looks at your ENV[’DYNO’] environment variable and only runs on the number of dynos you specify.
We’ll also need a way to trigger our heap dumps. For that, I’m using Postgres’ listen/notify feature. It’s a way to send messages without having to create a custom table to write and read from. To help out there, The Lone Dyno uses another small lib to help with listen/notify called hey you.
If you’re using the Puma web server, you’ll get the most data by tracing allocations on your cluster workers instead of on the controller process. We can enable tracing on these by utilizing the on_worker_boot blocks in your config/puma.rb file:
LANG:ruby
on_worker_boot do
  # Worker specific setup for Rails 4.1+
  # See: https://devcenter.heroku.com/articles/deploying-rails-applications-with-the-puma-web-server#on-worker-boot
  ActiveRecord::Base.establish_connection
end
You’ll need to make sure you’ve got AWS_ACCESS_KEY_ID and AWS_SECRET_ACCESS_KEY set in your app. Add the lone dyno and aws gems to your Gemfile:
LANG:ruby
gem 'the_lone_dyno'
gem 'aws-sdk', '~> 2'
I also created a bucket just for heap dumps in S3 and assigned it to AWS_S3_BUCKET_NAME.
Here’s the final code we’ll use to trace allocations and trigger heap dumps:
LANG:ruby
on_worker_boot do
  ActiveRecord::Base.establish_connection
  TheLoneDyno.exclusive do |signal|
    puts "Running on DYNO: #{ENV['DYNO']}"
    require 'objspace'
    require 'tempfile'
    ObjectSpace.trace_object_allocations_start
    signal.watch do |payload|
      puts "Got signal #{ payload.inspect}"
      Tempfile.open("heap.dump") do |f|
        ObjectSpace.dump_all(output: f)
        f.close
# ... (output truncated for draft)
Verify if everything works locally before deploying to production. I recommend using a .env file and the dotenv gem locally to set your AWS credentials.
You can test by spinning up your server with this:
$ env DYNO=web.1 bundle exec bin/puma -C config/puma.rb
This will trick The Lone Dyno into thinking you’re running on Heroku, and you should see debug output when your server boots.
LANG:code
[86337] * Listening on tcp://0.0.0.0:3000
[86337] Use Ctrl-C to stop
Running on DYNO: web.1
[86337] - Worker 0 (pid: 86338) booted, phase: 0
[86337] - Worker 1 (pid: 86339) booted, phase: 0
Running on DYNO: web.1
You should see Running on DYNO: web.1 for each worker process you’re using. In another terminal tab, you can trigger a heap dump:
LANG:bash
$ rails c
irb(main):001:0> TheLoneDyno.signal("thundercats are go")
NOTIFY web_1the_lone_dyno_hi_ho_silver, 'thundercats are go'
You may have to wait up to 60 seconds (the default sleep duration for checking for signals), but you should see another debug output when the server gets the signal.
Got signal "thundercats are go"
Once you see this output, check your S3 contents in the browser to make sure a file was uploaded correctly. If you download it locally, you can preview the contents using the $ less command:
$ less 2015-11-08T20-30-42+00-00-process-878-heap.dump
Make sure it looks like the sample heap dump contents earlier in the article. Once you’ve confirmed everything is wired up, verify you’ve set the correct config with $ heroku config, commit to git, then deploy.
Once you’ve deployed, you can either manually trigger a dump...
LANG:bash
$ heroku run bash
rails c
Running bash on issuetriage... up, run.5749
rails c
~ $ rails c
Loading production environment (Rails 4.2.5.rc1)
irb(main):001:0> TheLoneDyno.signal("Do you want to join my professional network on linkedin")
... or you can set up a scheduler task to take a heap dump every hour. You should see an S3 entry for every worker process that you’re running. If you’ve got four workers, you’ll generate four files.
When you first deploy, your heap dump will be fairly small. As the process runs over time, the heap dumps will be larger. I’m using the scheduler method, so I can retroactively look at a time when the memory use was high. To get this information, I use Heroku metrics:
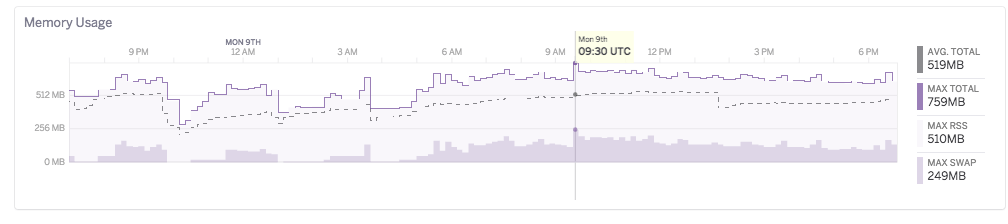
Note the high swap due to a perf regression (more on that later).
Analyzing Production Dump
After running for a while, my heap dump was around 500mb. Using the $ heapy command, we can see it has quite a bit more information than our example script.
LANG:bash
$ heapy read 2015-11-08T20-30-42+00-00-process-878-heap.dump
Generation: nil object count: 195095
Generation: 134 object count: 1637
Generation: 135 object count: 18852
Generation: 136 object count: 47628
Generation: 137 object count: 18216
Generation: 138 object count: 3183
Generation: 139 object count: 2055
Generation: 140 object count: 1673
# ... (truncated) ...
Generation: 192 object count: 126380
Generation: 193 object count: 49298
# ... (output truncated for draft)
The “nil” count is much higher, but in this case, we can somewhat ignore these since the memory increase happens gradually over time and not right at boot. You’ll see that we have long periods of small object counts, then spikes with larger counts. These spikes are likely where our memory use is coming from.
Debugging in a heap dump is a bit like looking for a needle in a haystack where the needle might be made out of hay.
Taking a look at the data, keep asking yourself why something might be in memory. Once you’ve figured out why, then ask if it needs to be in memory. For example, I looked at some of the smaller generations: 198 to 213. When I dug into those generations, I saw some innocent looking output:
LANG:bash
$ heapy read 2015-11-08T20-30-42+00-00-process-878-heap.dump 211
# ...
Duplicate strings
==============================
 1  "\"$user\",public-SELECT  \"issues\".* FROM \"issues\" WHERE \"issues\".\"repo_id\" = $1 AND \"issues\".\"state\" = $2  ORDER BY created_at DESC LIMIT 20 OFFSET 260"
 1  /app/vendor/bundle/ruby/2.2.0/gems/activerecord-4.2.5.rc1/lib/active_record/connection_adapters/postgresql_adapter.rb:193
 1  "a32"
 1  /app/vendor/bundle/ruby/2.2.0/gems/activerecord-4.2.5.rc1/lib/active_record/connection_adapters/postgresql_adapter.rb:185
At first glance, this seems innocuous. It makes sense that there would be SQL strings still in memory. However, these were from an older generation — why would they be kept around? Let’s look at that second string “a32” location:
LANG:ruby
class StatementPool < ConnectionAdapters::StatementPool
  def initialize(connection, max)
    super
    @counter = 0
    @cache   = Hash.new { |h,pid| h[pid] = {} }
  end
  def each(&block); cache.each(&block); end
  def key?(key);    cache.key?(key); end
  def [](key);      cache[key]; end
  def length;       cache.length; end
  def next_key
    "a#{@counter + 1}"
  end
It comes from the next_key in the Postgres statement pool. This is the class that Rails uses to generate prepared statements.
The idea is that once you create a prepared statement, instead of having to send over query and bind values, you can send over a prepared statement key and just the bind values. Since you’re sending less data, it’s faster. Also, this tells Postgres that you’ll be making that query again so it can optimize it.
This capacity is built to help your app run faster, but it is limited. Postgres cannot store an infinite number of prepared statements, and this also takes up memory on your app. For that reason, Rails limits the number of prepared statements it will cache to 1,000 prepared statements.
Now that we know why that string is in memory, does it make sense that we should be retaining a reference to it? (Hint: I probably wouldn’t be asking if the answer was “yes”).
The problem with that SQL query is that it has data directly in the limit and offset. Postgres doesn’t know that a query with DESC LIMIT 20 OFFSET 260 and DESC LIMIT 40 OFFSET 40 are the same thing but with different pagination, so it creates two different prepared statements. This takes up extra memory in Postgres and eats up lots of slots in our limited prepared statement cache.
Instead, we should be using bind values like:
"\"$user\",public-SELECT \"issues\".* FROM \"issues\" WHERE \"issues\".\"repo_id\" = $1 AND \"issues\".\"state\" = $2 ORDER BY created_at DESC LIMIT $ OFFSET $"
If we used this string instead, Rails can then reuse one prepared statement for each paginated query instead of the many it was creating. I proposed this change in issue #22250 and it’s currently being worked on by @sgrif.
App Level Issues
In the last example, we saw an issue with a library we are using: Active Record. As I mentioned before, heap dumps can be cryptic. Looking at the larger generations or the entire dump with all, we can see where a large amount of memory was allocated:
LANG:bash
$ heapy read 2015-11-08T20-30-42+00-00-process-878-heap.dump all
allocated by memory (141114900) (in bytes)
==============================
  42278576  /app/vendor/bundle/ruby/2.2.0/gems/activerecord-4.2.5.rc1/lib/active_record/result.rb:116
  34566467  .../connection_adapters/postgresql/database_statements.rb:168
  11026240  .../active_record/attribute_set/builder.rb:32
  10999680  .../active_record/core.rb:549
   6083752  .../active_record/core.rb:114
   4930472  .../active_record/associations.rb:162
# ...
We see that on active_record/result.rb:116 we allocated the most amount of memory. Does this mean we found another problem with Active Record? Let’s keep digging. We can see where the highest number of objects were referenced:
LANG:ruby
# ...
High Ref Counts
==============================
  1190545  .../active_record/result.rb:116
  260712  .../connection_adapters/postgresql/database_statements.rb:168
  190225  .../active_record/core.rb:114
  190080  .../active_record/attribute_set/builder.rb:18
  189665  .../active_record/associations.rb:162
# ...
Wow, so the highest reference count objects were also allocated on the same line. Surely this is a bug in Active Record.
Nope.
It so happens that I cheated a bit and know exactly where the performance regression came from. I purposefully reintroduced memory bloat into codetriage so that I could see what it looks like with a heap dump.
That second line in Active Record is where all database objects are allocated:
LANG:ruby
def exec_query(sql, name = 'SQL', binds = [])
  execute_and_clear(sql, name, binds) do |result|
    types = {}
    fields = result.fields
    fields.each_with_index do |fname, i|
      ftype = result.ftype i
      fmod  = result.fmod i
      types[fname] = get_oid_type(ftype, fmod, fname)
    end
    ActiveRecord::Result.new(fields, result.values, types) # <==== database_statements.rb:168
So what’s happening is that we were allocating one Repo object from the database; the bulk of this object is created when we call ActiveRecord::Result.new. The problem is that the includes(:issues) on the query was also creating thousands of issue records that weren’t being used.
This one Repo object holds the reference to all these thousands of issues. For each of those Issue objects, they’re allocated in roughly the same spot: ActiveRecord::Result.new. So what our heap dump is saying is that not only does the bulk of our memory come from Active Record, it is also referenced by another Active Record object. Maybe it’s not a smoking gun, but it is more information than we had before.
There are cases that are a little more clear. For example, Sam Saffron used heap dumps to debug Discourse to great result. In his case, the problem was in message_builder.rb, and the heap data showed that as a prime place to start looking:
LANG:code
9  /var/www/discourse/lib/email/message_builder.rb:85
6  .../actionview-4.1.9/lib/action_view/template.rb:297
6  /var/www/discourse/lib/email/message_builder.rb:36
6  /var/www/discourse/lib/email/message_builder.rb:89
6  /var/www/discourse/lib/email/message_builder.rb:46
6  /var/www/discourse/lib/email/message_builder.rb:66
One other thing he noticed was that Ruby Racer was generating a lot of objects:
LANG:code
72  /var/www/discourse/vendor/bundle/ruby/2.2.0/gems/therubyracer-0.12.1/lib/v8/weak.rb:21
72  /var/www/discourse/vendor/bundle/ruby/2.2.0/gems/therubyracer-0.12.1/lib/v8/weak.rb:42
Once he identified that, he reproduced the memory growth behavior and used memory_profiler to isolate the source of the objects. I recommend you do the same. You can also use derailed_benchmarks to run memory_profiler against your whole Rails app by simulating requests.
To Dump or Not to Dump
Taking a heap dump might not point directly to your problem, but it will give you more information than you had before. Use those clues to build different hypotheses and then test them out with scripts or other memory debugging tools.
Another heap visualization tool is tenderlove’s not very good heap analyzer, an online JS-based analyzer.
The memory tooling in the Ruby community has improved dramatically since Ruby 2.1 thanks to all involved. Let’s use these tools to the best of their abilities; the more community knowledge we generate and share around debugging memory, the more robust we can make our tools.