
The trusted software delivery solution for the agentic era
CloudBees Unify is the enterprise control and context plane for your entire AI-powered software delivery lifecycle: open, multi-agentic, and continuously secure.
Trusted by teams delivering software at global scale


Fragmentation slows delivery, increases risk, and limits scale
Wasted engineering time
Developers spend more time managing tools, pipelines, and handoffs than building value, slowing innovation and increasing burnout.
Slower time to market
Disconnected workflows and manual release coordination slow delivery and make it harder to ship with confidence.
Increased security risk
Fragmentation creates blind spots across the SDLC, making audits difficult, governance inconsistent, and risk harder to detect and control.
“CloudBees Unify understands what many platforms miss—ripping and replacing simply doesn’t work at the enterprise level. We need solutions that complement our existing systems, not conflict with them. That’s exactly why CloudBees Unify is so compelling to us.”


CloudBees Unify is the software delivery solution for the agentic enterprise
CloudBees Unify offers trusted AI-powered capabilities to support critical delivery workflows across modernization, automation, governance, and security.
Agentic DevOps—built for enterprise reality
Ship faster with confidence with CloudBees Unify - a smarter, AI-governed standard for safe software delivery

Shape the Future of Governed Agentic Software Delivery
Join a 90-day program to explore Unify’s latest agentic AI capabilities, work directly with CloudBees engineers, and help define how safe, auditable automation really works in production.
33%
Enterprise Apps to use Agentic AI by 2028
30%
Boost in delivery efficiency
75%
Use AI insights in pipelines
Intelligent release orchestration for enterprise scale
Automate, govern, and optimize complex release pipelines without slowing teams down.

“With CloudBees, we are able to mitigate the pain of both deployments and releases. Having a single solution from CloudBees allowed continuous integration and continuous delivery to be very closely coupled with each other.”

$2m
Annual release of efficiency savings
1.5k
Hours of Dev productivity unlocked to focus on innovation
60%
Reduced error rates through automation
Continuous security and compliance with intelligent automation
Transform scattered security tools into one enterprise-grade AI-ready cohesive, policy-driven control plane. Keep your tools, gain compliance, developer alignment, and faster remediation.

"CloudBees provides robust governance, secure controls, and Jenkins enterprise feature that are critical in a banking environment."
100x
In cost savings to fix a vulnerability pre-prod
97%
Of security professionals prefer unified cloud security dashboard
2x
Faster with security in the SCLC
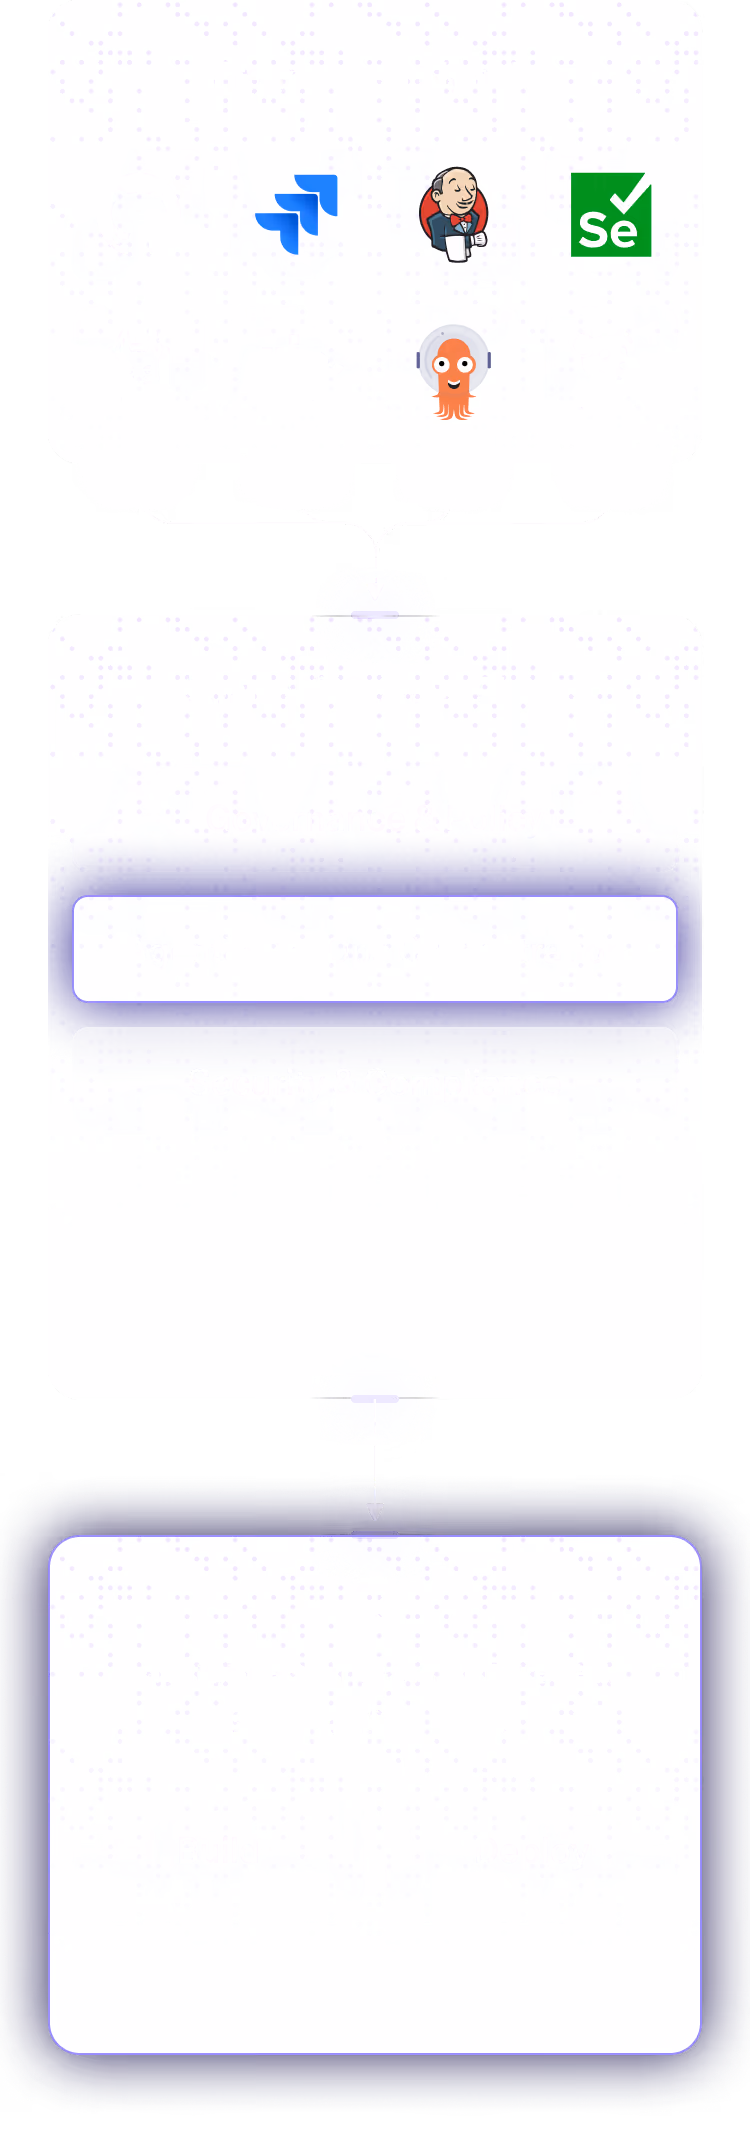
Modernize your DevOps on your terms
CloudBees Unify is the open control plane that meets you where you are. Governing, automating, and analyzing every CI/CD pipeline across hybrid and multi-cloud environments without a painful rip-and-replace.

"Switching to CloudBees CI meant we no longer needed to maintain 35 to 40 static Jenkins agents. This has made tremendous sense in terms of time and cost savings."

Proven and trusted results for enterprises
CloudBees Unify's agentic software delivery solution empowers enterprises by eliminating toil, accelerating delivery, and embedding continuous security, while giving their developers intelligent tools to innovate faster and with confidence.
up to
70%
Less build and development time
up to
10x
Faster to deploy and release software
up to
21k
Engineering hours saved annually
Trusted by enterprises, loved by developers
Salesforce migrates DevOps to the cloud with CloudBees CI
Salesforce moved software development to CloudBees CI on Amazon EKS, improving productivity, security, and supporting the continuous delivery of innovative solutions on the Salesforce platform.

Autodesk builds better software faster with CloudBees
Standardize on CloudBees CI, making secure, automated CI/CD pipelines available to a development organization of 4,000 engineers

Acquia partners with CloudBees to simplify and scale DevOps
Acquia, partnered with CloudBees to unify over 16 siloed Jenkins instances into a single, secure CI/CD solution, enhancing operational efficiency of digital experiences.

American Express CBT gains competitive advantage with CI/CD
American Express Global Business Travel won the 2019 CloudBees Innovation Award for CI/CD Automation Excellence based on its DevOps transformation.
Latest blog posts

Bee Giving: Strengthening Our Culture by Serving Our Communities

OpenClaw Is a Preview of Why Governance Matters More Than Ever

CloudBees Appoints Philippe Van Hove as Chief Revenue Officer to Accelerate Growth as Company Scales its AI-powered DevOps Solution