
As reported in the 2026 State of Code Abundance Report, AI now generates or assists in writing 61% of the average enterprise codebase. 64% of engineering organizations describe it as widely adopted or fully integrated, and 52% report a significant increase in software development output as a result.
This is exactly what code abundance refers to—a new condition in which AI generates code faster than enterprises can verify, govern, and attribute its output. And so far, there is no established standard for measuring whether organizations are ready to govern it.
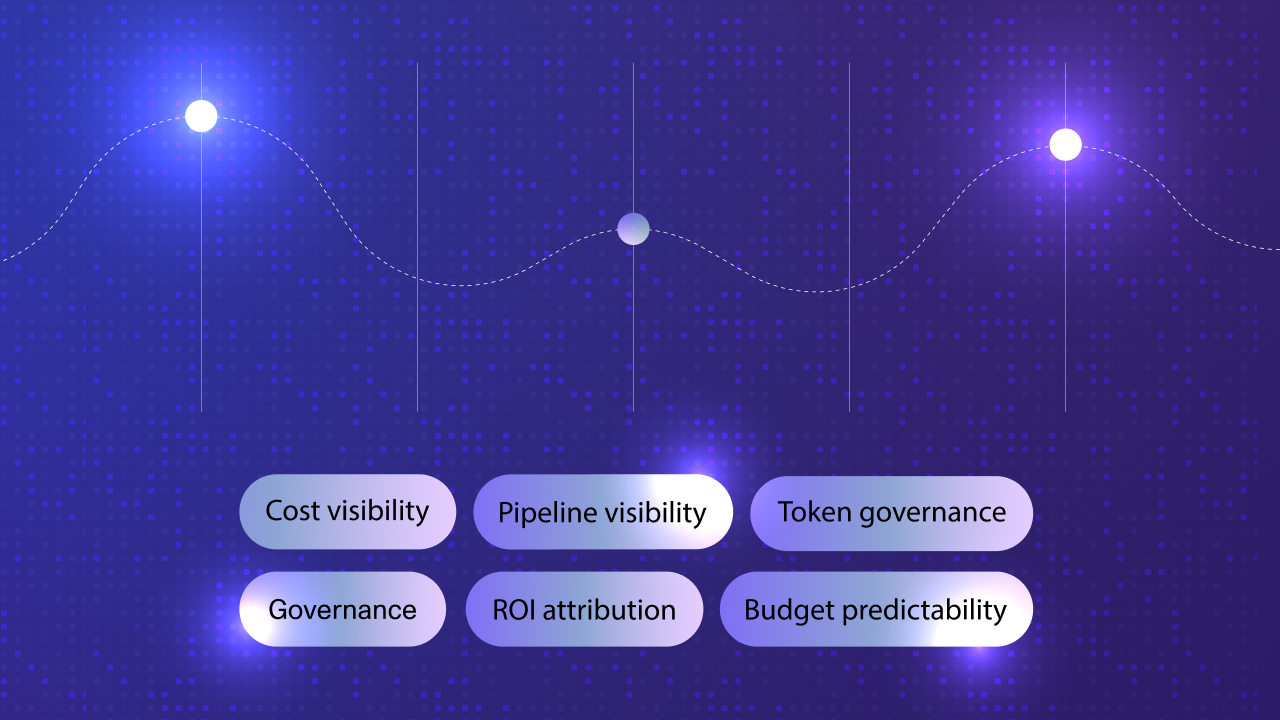
To give organizations a benchmark to compare themselves against, CloudBees developed the Code Abundance Readiness Evaluation (CARE) Score, a proprietary framework designed to help measure how enterprise leaders perceive their readiness across six dimensions critical to governing AI-generated code at scale.
In testing it against the broader findings of our 2026 State of Code Abundance report, a survey of more than 200 enterprise technology leaders, a pattern emerged. Organizations are reporting a significantly higher level of confidence than what their operational experience reflects.
This post unpacks all six CARE Score dimensions. For each, we explore where leaders' confidence diverges from their operational experience and offer a framework for scoring yourself honestly, so you can understand where your organization actually stands.
What the CARE Score Measures
The CARE Score assesses organizations across six dimensions, each scored on a 0–100 scale. The six scores are averaged into a composite, with the most positive response converting to 100 and the least positive to 0.
- Cost visibility measures how clearly organizations can track and attribute AI-related spend across teams and initiatives.
- Budget predictability measures how confidently organizations can forecast AI spending quarter to quarter.
- Productivity measurement assesses how effectively organizations can link AI tool usage to business outcomes.
- Governance maturity measures how fully organizations have implemented and enforced formal policies and guardrails for AI tool usage.
- Pipeline visibility measures the extent of cross-tool visibility organizations have into AI-generated code at every stage of the delivery pipeline.
- Token governance measures how well organizations have implemented limits and automated controls on AI token consumption.
The survey asked leaders to rate their organizations across each of the six CARE Score dimensions. Based on those responses, the 2026 industry baseline is 83.6 out of 100, reflecting strong self-reported confidence across all dimensions. How do we square this confidence with the operational challenges that organizations report facing?
Our hypothesis is that the survey didn’t provide defined parameters for what “good” actually looks like. Organizations know they're doing something across each dimension, and in the absence of a clear standard for what's sufficient, doing something tends to feel like enough. So we developed rubrics for each dimension, describing what organizations operating at a high, medium, or low level of readiness do and experience.
Defining What Readiness Looks Like Across Each Dimension
The CARE Score dimensions were assessed as part of the broader State of Code Abundance survey. Where the CARE Score questions asked leaders how ready they feel, the rest of the survey asked what they are actually experiencing on the ground. Throughout this section, we put those two sets of responses side by side.
The CARE Score tells us where the industry rated itself across each dimension. What it didn’t tell us is what a given score actually means on the ground; what strong AI readiness actually looks like in practice. Drawing on the survey data and our experience working with enterprise engineering organizations, we've developed the following parameters to give organizations a real operational baseline to score themselves against.
For each dimension, we've included data from the broader survey that shows where perceived readiness tends to diverge from operational reality. The goal is to help you calibrate your score against what organizations are actually experiencing, not just how they're rating themselves.
Cost Visibility
CARE Score: 91% of organizations surveyed rate their ability to track and attribute AI costs as clear or very clear.
But only 31% can attribute AI spend to specific business outcomes, and 36% track spend without measuring ROI at all. To provide a reference point for assessing cost visibility more honestly, here is how we define each score band:
- High (80-100): Attribution runs from token to team to outcome. You can answer on demand which teams account for the most AI spend, which initiatives spend is tied to, and what business outcomes it's generating.
- Mid (50-79): Visibility exists at the tool level. You know what your AI licenses cost and roughly what your teams are using, but spend doesn't connect to outcomes.
- Low (below 50): Spend is tracked at the vendor invoice level. Which teams are using what, and to what end, isn't visible from a single place.
Tracking spend and attributing it are different capabilities, and the survey suggests the gap between them is wider than most organizations recognize.
Budget Predictability
CARE Score: 89% of organizations describe their AI spend as predictable or very predictable quarter-to-quarter.
But when polled outside the CARE framework, only 45% describe their AI-related spend as highly predictable. And as AI accelerates code output, the downstream costs are rising too. 54% report a significant increase in CI/CD infrastructure spend in the past 12 months, and 53% report significant increases in testing, security, and deployment costs.
For budget predictability, here is how we define each score band:
- High (80-100): Forecasts are built from usage patterns and enforced limits. You can project next quarter's AI spend with the same confidence as your infrastructure spend. There are very few end-of-quarter surprises.
- Mid (50-79): Last quarter is a reasonable guide for this quarter until a new tool is rolled out, a team scales usage, or a model upgrade changes the cost curve. Predictability depends on environmental stability, not on controls within it.
- Low (below 50): Budget is set annually based on license costs. The variable consumption layer—tokens, API calls, and inference spend—isn't modeled, and neither are the downstream infrastructure costs that rise with it. End-of-quarter reconciliation is where the surprises surface.
The data suggests most organizations are forecasting the license layer well enough, but struggling to anticipate the costs that actually move the number (infrastructure, testing, deployment).
Productivity Measurement
CARE Score: 92% of organizations say they're confident or very confident they can measure AI productivity gains and ROI.
But when asked how they measure it, 54% primarily point to time saved, a self-reported activity metric that doesn't indicate whether the business is shipping better or faster. The score bands below reflect what we believe meaningful productivity measurement actually requires:
- High (80-100): Productivity is measured against delivery outcomes like cycle time, defect rates, and release frequency. There's a methodology that links AI tool usage to changes in those metrics, with the results reported at the leadership level.
- Mid (50-79): Productivity is measured by developer surveys and “time-saved” estimates. The numbers feel positive, but can't be connected to whether the business is actually improving on any delivery metric.
- Low (below 50): Productivity is measured by adoption: how many developers are using the tools and how often. Whether that usage translates into anything beyond faster code generation isn't tracked.
Measuring AI productivity and understanding its impact on delivery are not the same exercise, and most organizations are still doing the former while assuming it implies the latter.
Governance Maturity
CARE Score: 86% of organizations say they have fully or mostly implemented formal policies and guardrails for AI tool usage.
But only 56% say those policies are always enforced, and only 12% have a dedicated AI governance team. When something breaks, 46% say accountability lands with the CTO or VP of Engineering by default. The score bands below reflect what we think separates organizations that say they have governance from those that actually enforce it effectively.
- High (80-100): Policies are enforced at the system level, not through manual review. There's clear ownership for AI governance. When AI-generated code causes a production failure, there's an established accountability chain.
- Mid (50-79): Policies exist and are documented. Enforcement depends on the team, the release, and who's reviewing. Governance holds when it's prioritized, and slips when it isn't.
- Low (below 50): AI tool adoption has outpaced policy. Guidelines exist at the tool approval level, but don't govern how AI-generated code moves through the delivery pipeline. Accountability for failures defaults upward as a result.
Based on the data, it seems that most organizations have the policy layer covered; it's the operational infrastructure needed to back it up that's still missing.
Pipeline Visibility
CARE Score: 86% of organizations report full or high visibility into AI-generated code across the delivery pipeline.
If visibility into AI-generated code were as strong as organizations report, you’d expect production to be stable. But 81% have seen production issues increase as a direct result of AI-generated code.
We define each score band for pipeline visibility as follows:
- High (80-100): You have a cross-tool view of where AI-generated code is at every stage of the pipeline. Builds pass and releases proceed based on reconciled signals from every tool in the chain, not on a green light from any one of them.
- Mid (50-79): Visibility exists within each tool, but no single view reconciles those signals into a definitive answer on whether a specific release is actually ready to ship. Release decisions are made by manual aggregation, which isn’t always consistent.
- Low (below 50): Visibility is largely retrospective. Build status, test results, and deployment logs exist within individual tools, but there's no live view. By the time a release decision needs to be made, those reports may already be out of date.
Knowing what's happening inside each tool and whether a release is ready to ship are different things. Without a layer that reconciles signals across the entire pipeline in real time, most organizations make that call without having the full picture.
Token Governance
CARE Score: 86% of organizations say they have fully or mostly implemented specific limits and controls on AI token usage.
But the broader survey results show that only 27% have set hard limits or quotas, and only 18% have implemented automated controls to manage that spend. Here is what we believe organizations should be doing across each score band.
- High (80-100): Hard limits are set and enforced at the system level by team, project, and use case. Automated controls catch spend spikes before they hit the budget.
- Mid (50-79): Quotas exist on paper and in budget approvals. Monitoring is in place and alerts fire when thresholds are breached, but the response is manual.
- Low (below 50): Token usage is governed by license agreements and team norms. There are no hard limits, no automated controls, and no systematic visibility into consumption before the invoice arrives.
The survey data suggests that most organizations are managing token spend reactively rather than by design.
Run the Assessment for Your Organization
The parameters above provide a practical reference point for gauging your organization against each CARE Score dimension. Now that you know how to score yourself accurately, use this prompt to take the assessment.
It works with ChatGPT, Claude, Gemini, or whichever LLM you use. Paste it in and answer the questions it surfaces. Use the output as a starting point for a leadership conversation about where your organization needs to invest to make the most of this era of code abundance.
CARE Score Self-Assessment Prompt
To learn more about how rising code volume is straining testing and security infrastructure, and why governance and accountability are struggling to keep pace, download the 2026 State of Code Abundance report.