

Introduction
Grafana alerts are an easy way to set up alerting from right inside your existing Grafana dashboards. It's a great solution if you use Grafana's rich metrics visualization capabilities and want to handle all your monitoring and alerting needs in one place. If you've ever been frustrated when you had to switch to another tool to set up monitors and then another to configure alerts, Grafana has solved your problem.
In this post we'll cover everything you need to know to get started with Grafana alerts. How do they work? When would you want to use them? And finally, we will go through an example of setting up an alert that sends a message into a Slack channel.
Why Do We Need Alerts?
Alerts are a key part of deploying a service to production, whether your software is a blog, e-commerce website, or power station. It's important to know about issues with the software quickly. We can't stare at dashboards with dozens of metrics all day. And alerts provide an easy way for a machine to alert us about any unusual events happening in our software.
What Are Grafana Alerts?
Grafana alerts are a way to send notifications when a metric crosses a threshold you have configured. For example, you might want to send a Slack message to your team's channel when your cloud server's CPU utilization exceeds 80 percent.
Grafana alerts are split into four key components: alert rules, contact points, notification policies, and silences.
Alert Rules
Alert rules are how we define when an alert is triggered. Say we wanted to trigger an alert when our Java service's memory utilization exceeded 90 percent except for right before the garbage collection cycle is triggered. We could configure an alert rule that is triggered when memory utilization exceeds 90 percent for longer than the expected duration of garbage collection.
Contact Points
Contact points define where the message is sent when an alert rule is triggered. Typically, you will want to send different alerts to different channels, depending on the severity of an alert. For common alerts maybe a message in a Slack channel is enough. But for potentially severe issues, you may want to actually page a team member to make sure the issue is addressed immediately. Grafana alerts support a wide range of contact points, including Slack, email, webhooks, PagerDuty, and more.
Notification Policies
Notification policies allow you to specify where and how frequently you want alert notifications to be sent. One common pattern is to limit the number of times a notification is sent during a certain time period. If you have an alert triggered because CPU utilization is over 90 percent, that's great. But if the issue persists for fifteen minutes, do you want to get a notification every minute? Using notification policies, you can limit the number of notifications you get per minute to a manageable level. Otherwise, you may end up with a hundred alert notifications in your Slack channel for the exact same issue.
Silences
Silences are a way to configure periods of time to suppress notifications. During a silence, Grafana will continue to track metrics and trigger alerts, but it won't send notifications to any of your channels. Grafana lets you configure silences to only suppress notifications from alert rules with particular labels. Once the silence expires, notifications will be sent again as though nothing had happened.
A great way to use silences is to suppress nonurgent notifications during holidays or weekends. You might want to have tiered alert rules where at 70 percent CPU utilization you send a message to your Slack channel, then at 80 percent utilization you send an email to the team, and finally at 90 percent CPU utilization you page team members to address the issue. You might want to configure a silence on weekends that suppresses the 70 percent and 80 percent CPU utilization alerts while leaving the more serious 90 percent paging alert up.

A Practical Example: Sending a Notification to Slack When Memory Use Is High
Usually, we think of alerts being for critical events. But it can be useful to be notified when something unusual but not necessarily critically urgent occurs. One way to surface interesting and unusual events is to set an alert and post notifications to a Slack channel. Then anyone who is interested can take a look when they have time.
Setting Up a Slack Callback Link
If you don't have your own Grafana environment, I've created a Docker compose file to help you get started here. This tutorial uses the default metrics provided by Prometheus, but you can use any metrics source.
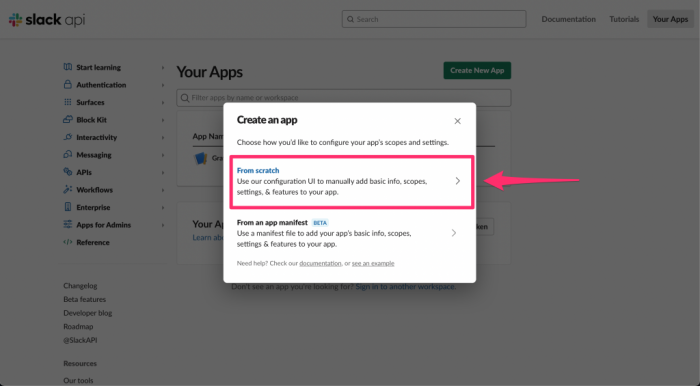
First, we will set up a Slack app and get our Slack callback link. Creating a Slack app is easy. Just log in to Slack.com and go to https://api.slack.com/apps?new_app=1.
You should see a view like the one below. Choose to create an app from scratch.
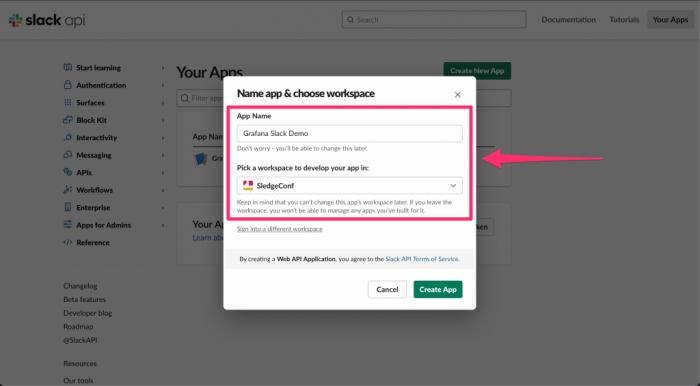
Next, pick a name and select one of your Slack workspaces for the app to run in. If you don't have a Slack workspace, you can create one for free via Slack's website. See a screenshot of my setup below.
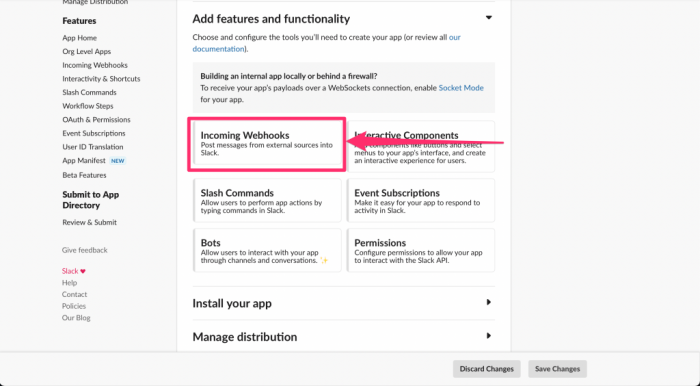
Finally, click the button that says Incoming Webhooks.
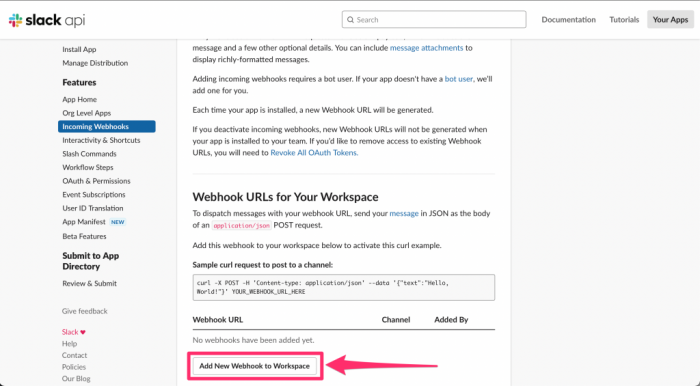
Then select the sliding button that says off by default so that it turns green. Once that is done, an Add New Webhook to Workspace button should appear. Click that button and select a channel for your webhook.
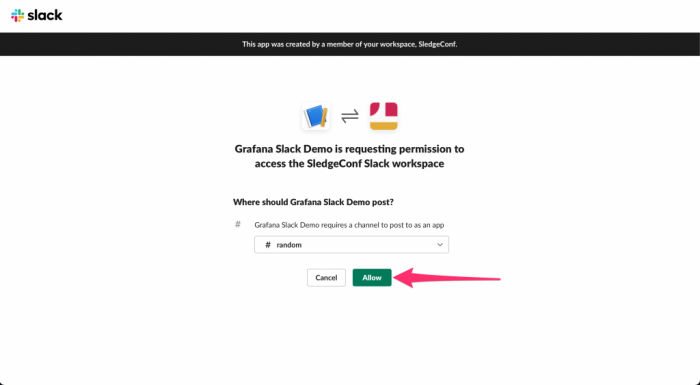
Choose whichever channel you wish and click to continue.
The last step in Slack is to copy the webhook URL.
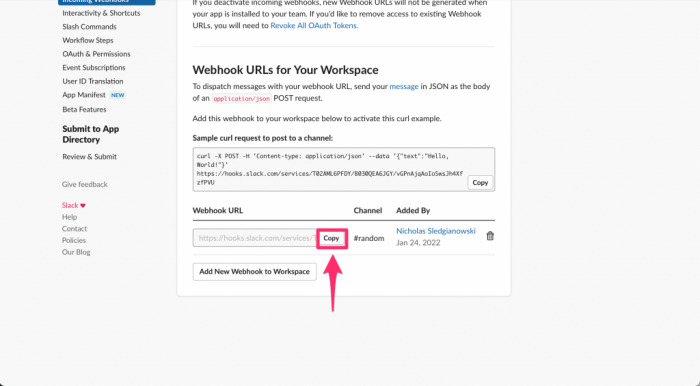
That's all it takes to set up webhooks in Slack.
Setting Up the Alert in Grafana
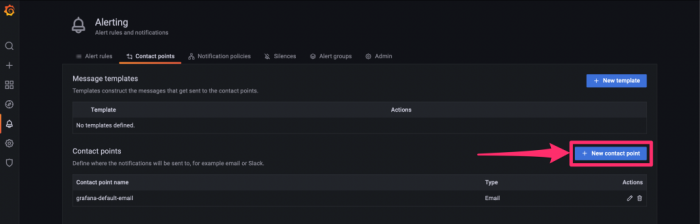
Next, we'll set up the contact point in Grafana. Select the Alert option in the sidebar and switch to the tab for contact points.
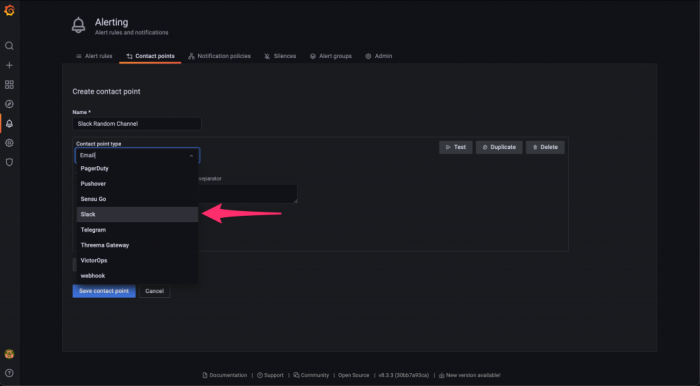
In the contact points menu, we can set a name and then select a contact point type from the dropdown menu.
Once you select a contact point type, you will be shown a bunch of form boxes. But you don't actually need to fill most of them in. Just scroll down and populate the box that says Webhook URL.
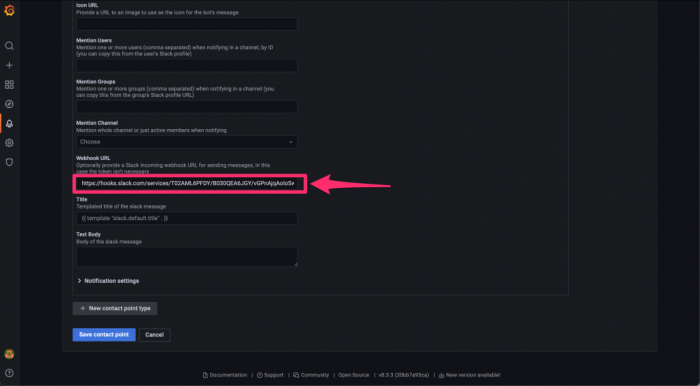
Hit the Save contact point button and you will have created your Slack contact point. It took a lot of screenshots, but overall it's a pretty simple process. One thing to keep in mind is that your webhook URL should not be shared publicly. All anyone needs to post messages to your Slack is that URL.
Now for the fun part: setting up your alert rule to send messages. For this demo, we are setting an alert trigger when our allocated heap memory exceeds 52 megabytes.
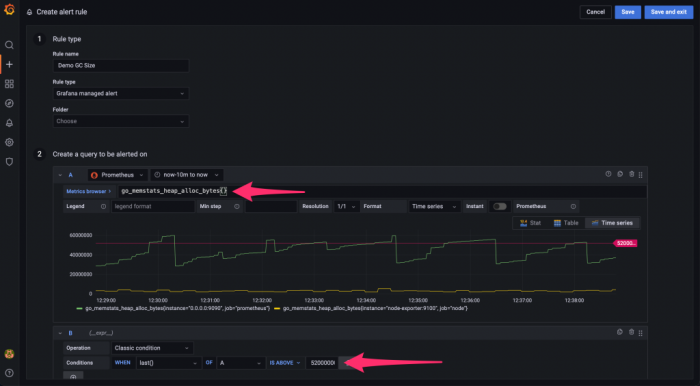
To do that I've set up a query for go_memstats_heap_alloc_bytes. Just type mem into the search box, and Grafana will display all the available metrics that contain that substring. Then update the condition from the default value of 3 to 52 million. Grafana will put a red line on the graph to show you where exactly your trigger is in context.
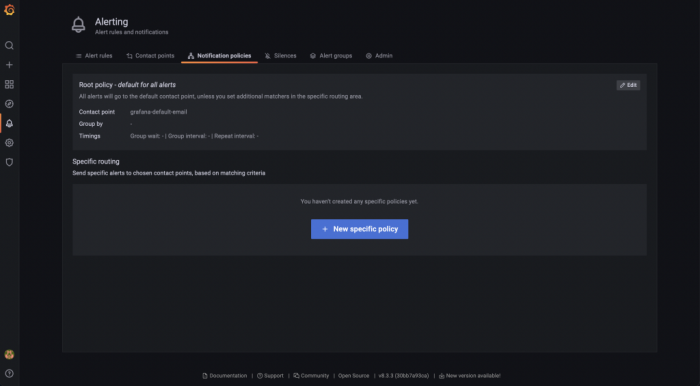
The last step is to create a notification policy to channel alert messages to Slack. Go to the notification policies tab in the alert section of Grafana and click the New specific policy button.
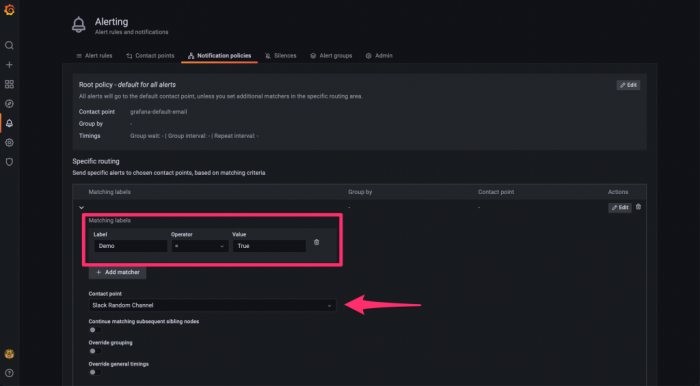
I need to set matching labels for my alert rule, which are Demo=True. Then in the contact point dropdown menu, select Slack. Then click Save Policy.
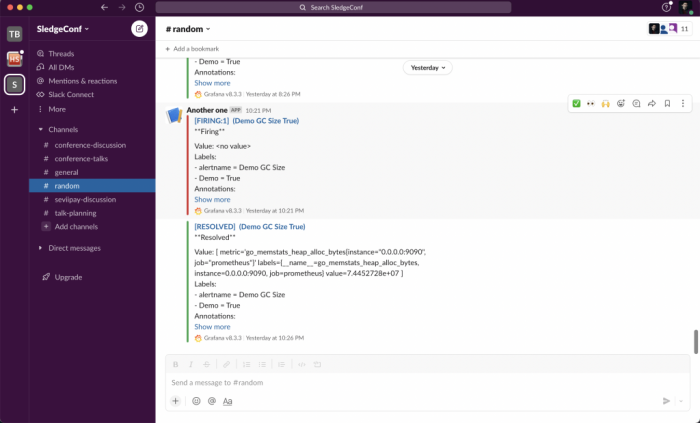
Here's the message I get in Slack.
Conclusion
In this post, we covered everything you need to know about how to implement your own Grafana alerts.
This post was written by Nicholas Sledgianowski. Nicholas is a software engineer with over six years of experience working at agencies and product companies. He has developed a wide range of software including microservices, data pipelines, platforms as a service, and even the occasional monolith. For the last few years he has worked in a DevOps environment building and supporting the services that power voice assistant programs.