

CloudBees was founded in 2010 to enable developers to go from an idea to production with no friction by introducing continuous integration with @DevCloud by CloudBees. It was built on top of powerful open-source technology called Jenkins which automated CI/CD for software development.
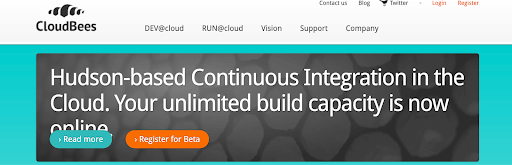
It was the start of the DevOps movement, and since then, Jenkins has really taken off. Jenkins today is used by 10.3 million developers globally and has more than 40% of the CI/CD market share. CloudBees has become the de-facto Enterprise Jenkins company with more than 500+ enterprise customers globally.
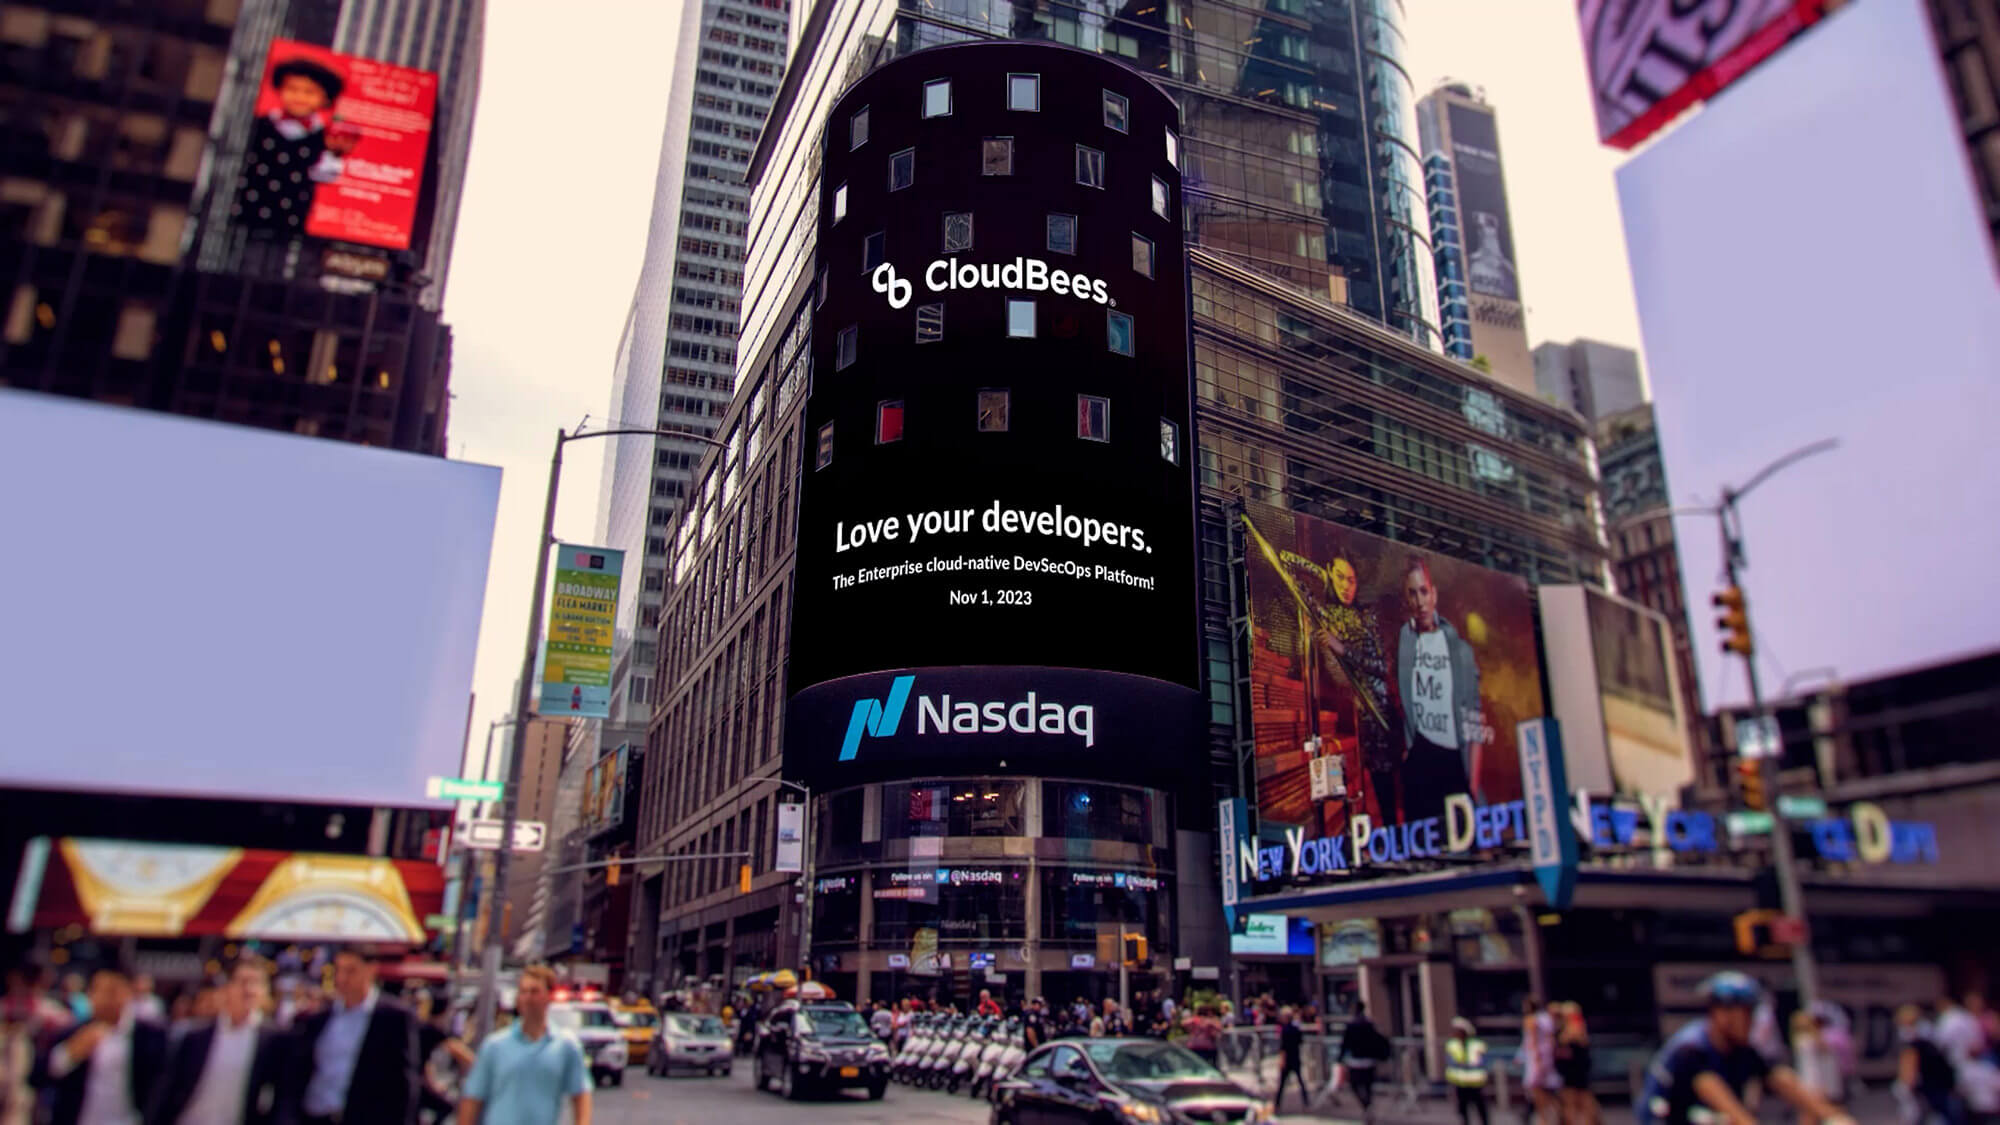
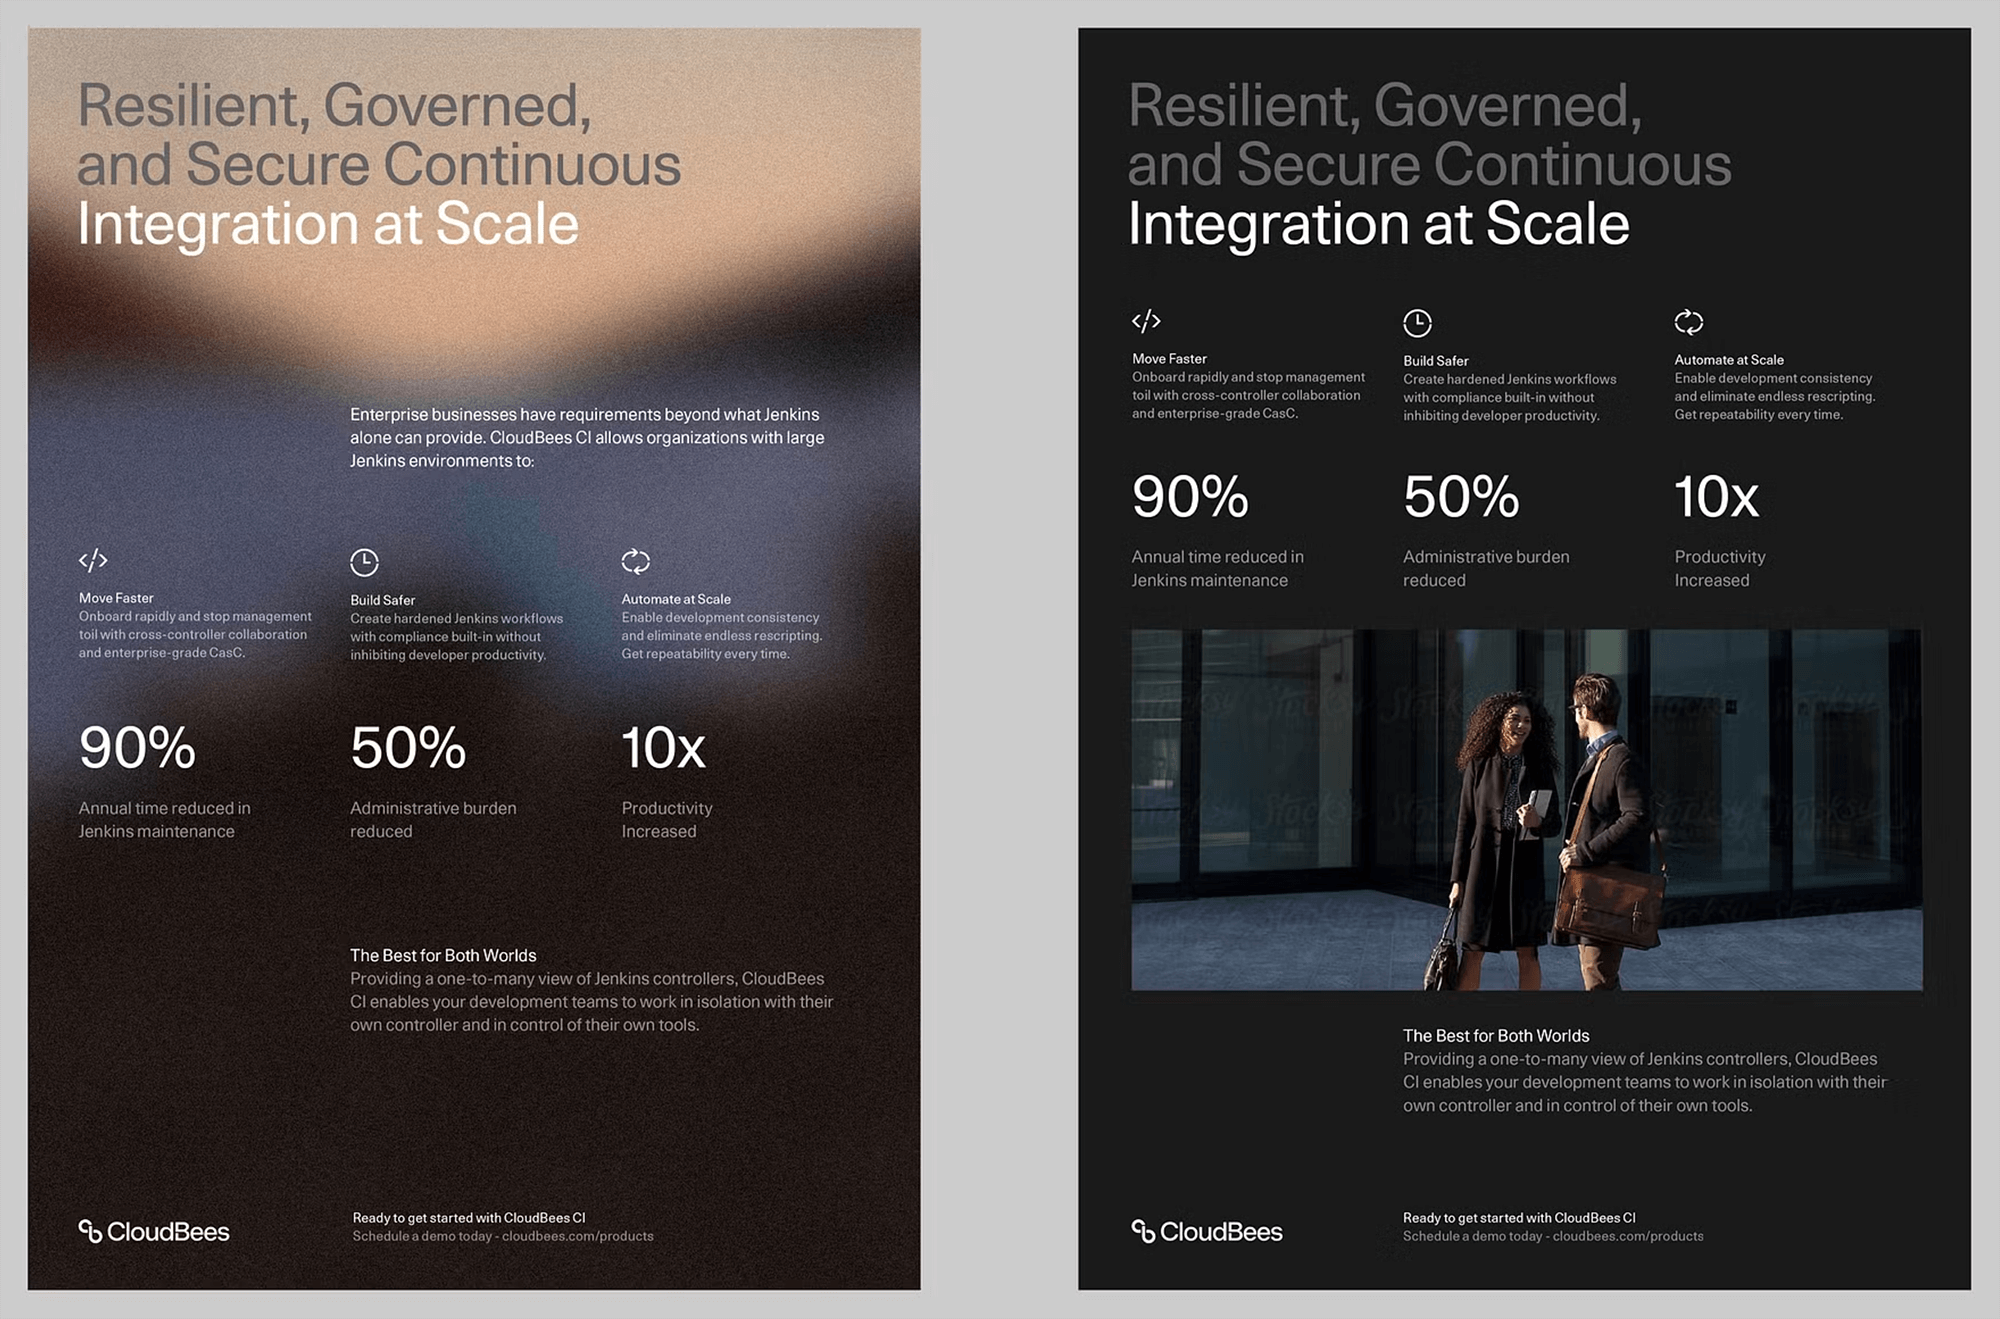
In the last year, CloudBees has launched the biggest update for Jenkins performance and scalability in over a decade with CloudBees CI. We’ve also launched the new CloudBees DevSecOps Platform responding to the modern era of cloud-native application development.
A new brand for the new era
With the introduction of the new CloudBees Platform, CloudBees is transitioning from being just a provider for Enterprise Jenkins to a strategic cloud transformation partner for organizations. Only 30% of enterprise workloads have moved to the Cloud, and Gartner predicts 50% will be in the Cloud by 2027—the future is hybrid and heterogeneous.
Our solution is uniquely positioned to solve this problem for thousands of organizations who need a CI/CD platform that can traverse both worlds—traditional and on-prem, and modern and cloud-native. This is one of the primary reasons I joined CloudBees as the Chief Marketing Officer.
Every new CMO wants to leave an imprint with a rebrand, the irony of that isn’t lost on me. But our needs emanated from the shift in our strategic vision—we wanted a future-ready brand that reflected our values, our positioning, and our ambitions. Our customers had to be at the center of this work. We wanted a brand that would be forward-looking, moving into a brighter, more brilliant future together with our customers. Our customers were evolving and we needed to evolve with them.
So, we put a small, nimble team together and gave them an ambitious timeline. Our internal brand team partnered with Motto, a global strategic brand agency focused on tech and innovation, to bring our vision to life with a new brand identity. Today, we’re reintroducing ourselves with a new look and feel, building off the same roots we’ve always had.
Our unique approach to DevOps
As I mentioned earlier, we have a very unique approach to DevOps. We’re not married to a particular religion of deployment or framework or tools, we want to give the flexibility to the developers to choose what they want. Bees have been part of our identity from the earliest days. Just like bees, developers thrive as a hive. Being inclusive and working together is at the heart of what they do on a daily basis.
Bringing those two elements together, we learned that bees see the world very differently from humans. They see the world in ultraviolet light, an indicator to seek out pollen and make more calculated decisions. This difference allows bees to interact with their environment in ways that are uniquely suited to their roles, which echoes the CloudBees solution. We allow our customers to see a detailed overview of the process, enabling them to navigate through their software development environments and make more calculated decisions to build better, faster, and safer.

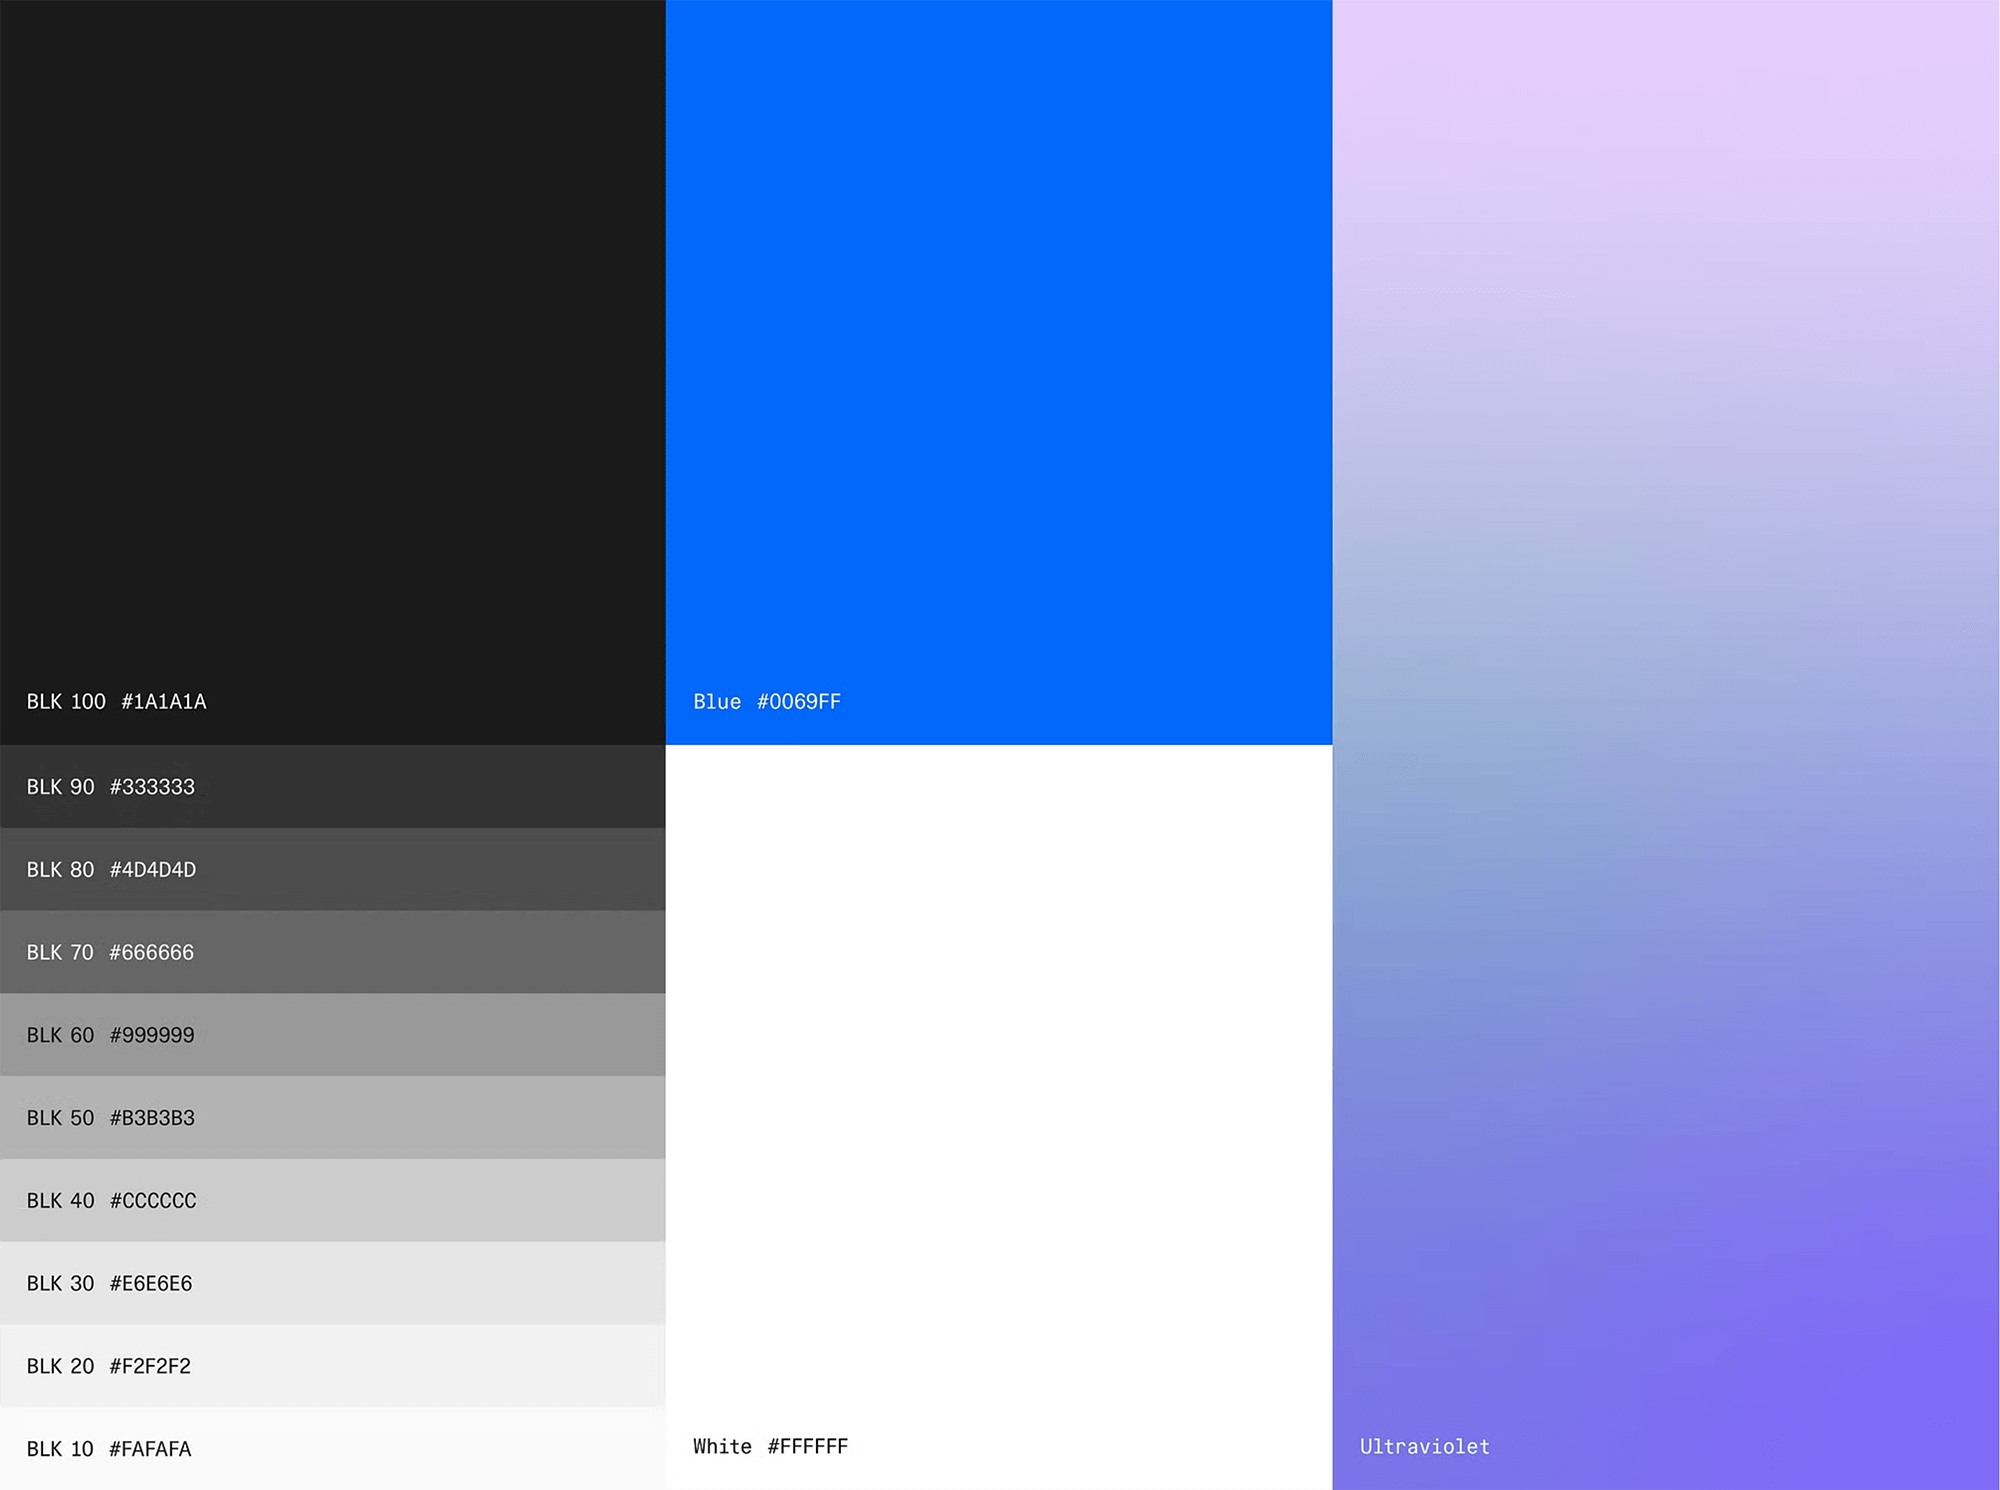
Our new color system - the ultraviolet gradient
Our core palette is formed through a set of black tints inspired by developers’ love for dark mode. This range, from deep black to clean white, provides a sophisticated and modern aesthetic. A vibrant pop of blue adds energy and a sense of trustworthiness into the palette.
Our ultraviolet gradient represents the vision of bees and embodies the idea of seeing the world from a new perspective. Our secondary color palette adds depth, dimension, and versatility.
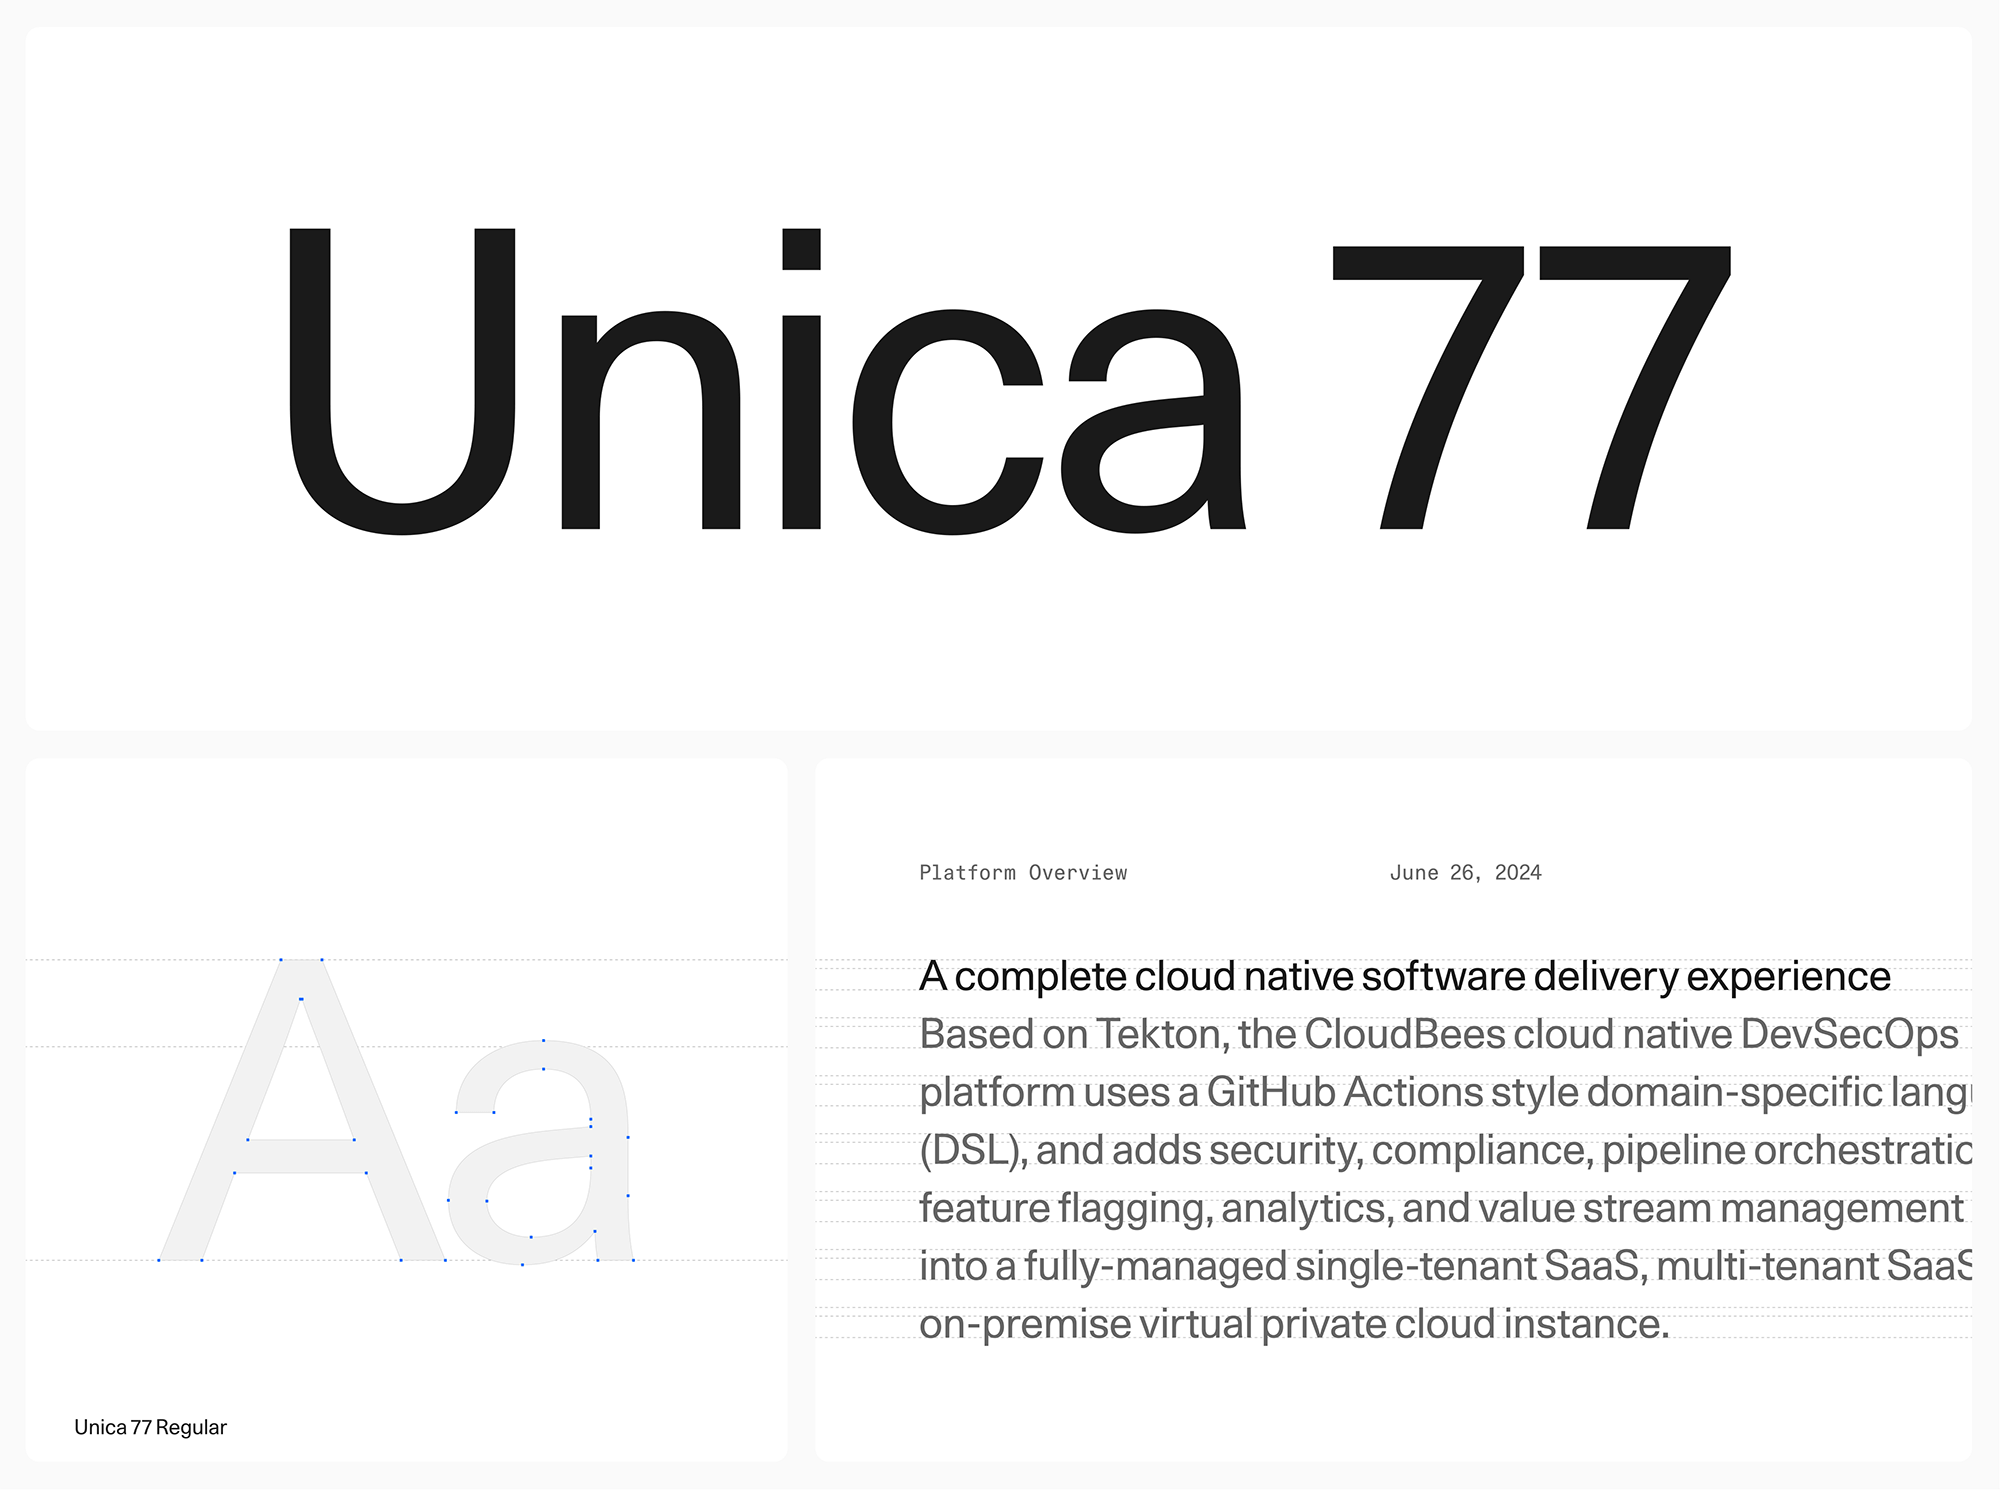
Our new font - Unica 77
To form the basis of our typography system, we opted to use Unica 77, a digital revival of Haas Unica (1980) with its roots going back to Switzerland, an informal nod to our founders. Its clean, bold lines, and hyper-readability make it the perfect choice to create a modern, tech feel whilst having enough roundness and softness to ensure it still feels friendly and approachable, which is core to CloudBees.
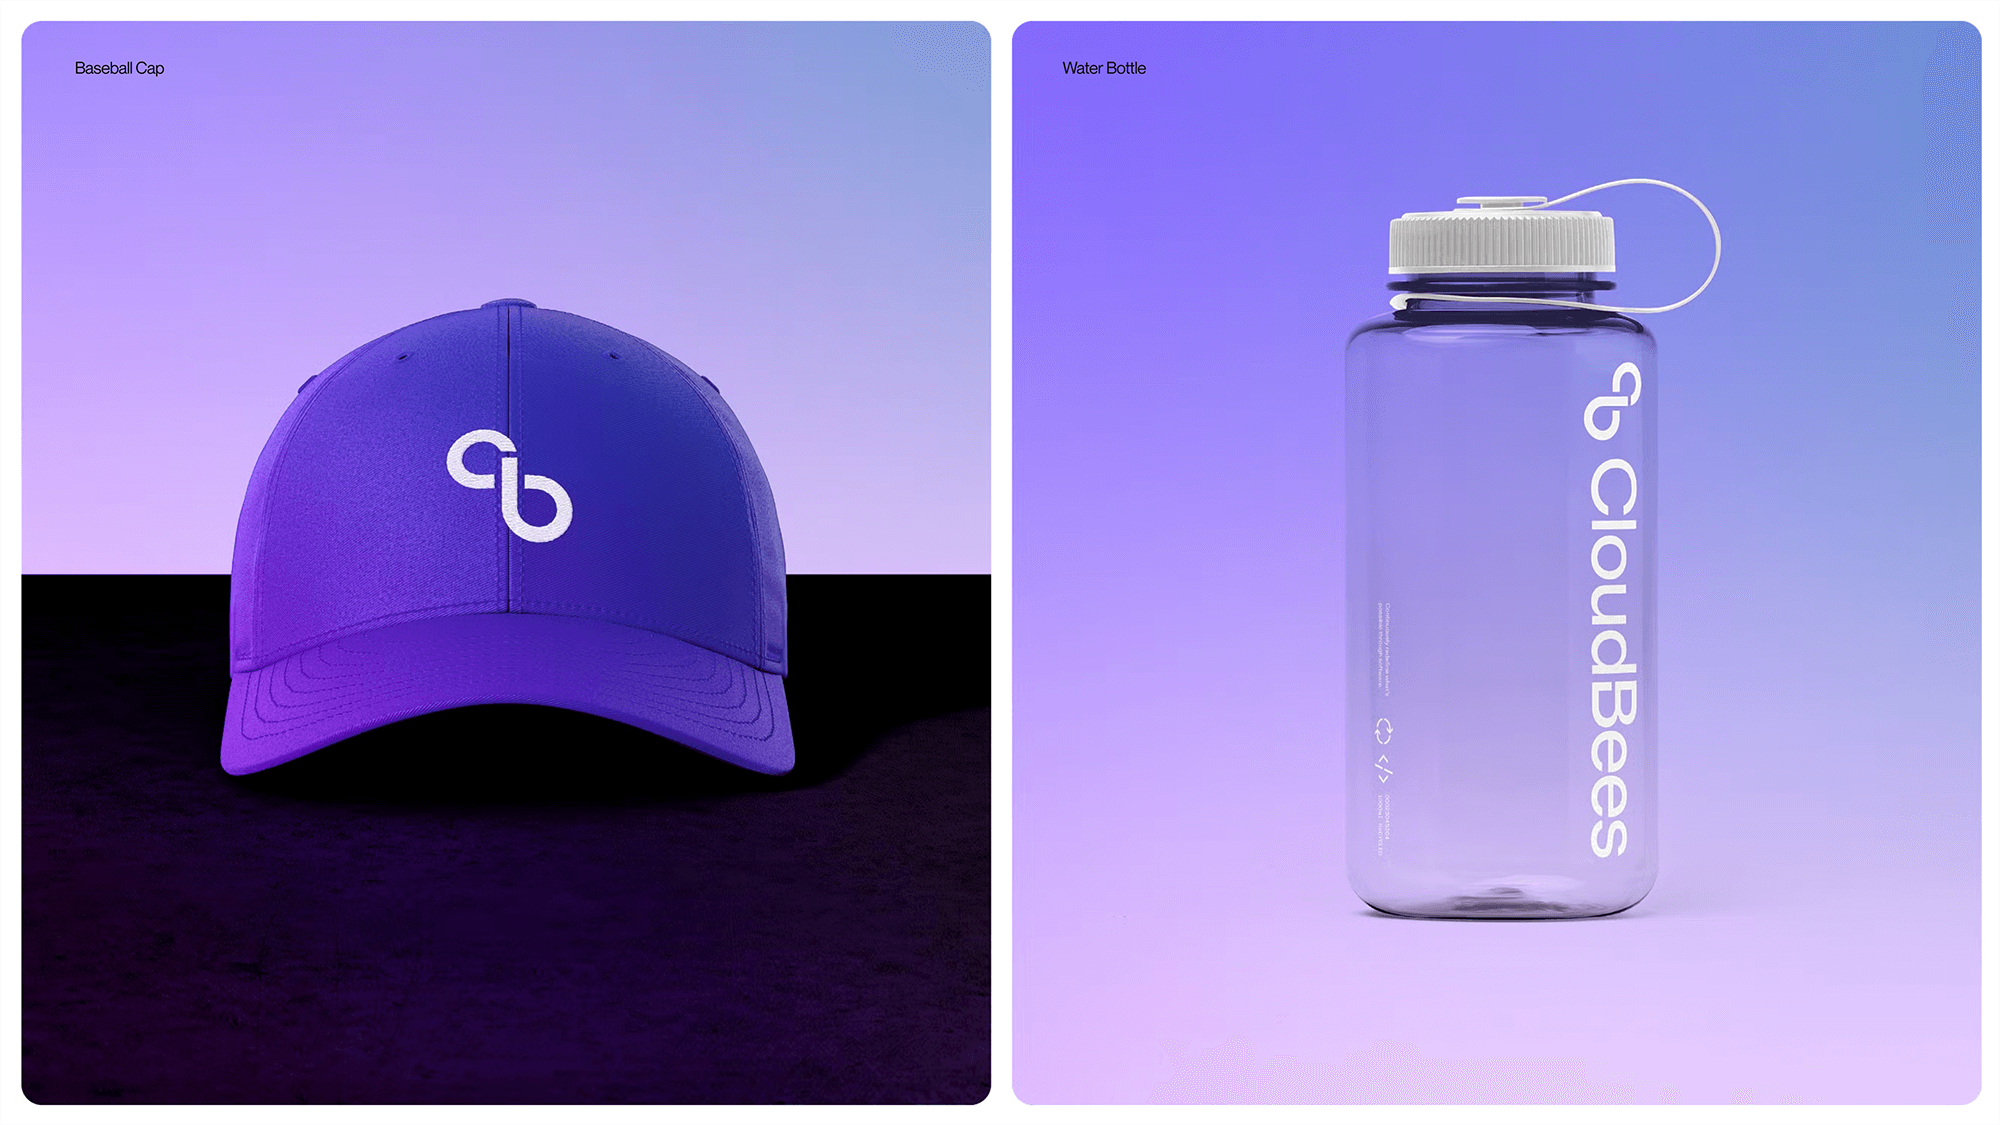
Our new logo and logotype - the new, modern CloudBees
Our logo has always been distinctive, echoing the DevOps infinity symbol to represent the seamless flow of work between software development and IT operations. However, feedback from our customers and partners indicated that the "c" and "b" within the logo weren't easily recognized. So, we enhanced those elements to make them more prominent and clear.
Our updated logotype features the Unica 77 typeface. Notably, the "B" includes a unique cut, symbolizing the distinctive stripes of bees, further reinforcing our brand identity.
Our redefined mission, vision, and values
CloudBees is not only going through a strategic transformation, we’re also going through a cultural transformation. The external brand is not real until it is a reflection of our internal values. So, we took this opportunity to put pen to paper and redefine our mission, vision, and values. We’re proud to share that with all of you.
Vision: Continuously redefine what’s possible through software.Mission: Empower developers to build better, faster, and safer.
Our redefined values:
- Better together
- Entrepreneurs at heart
- Exceed expectations
- Serve with passion
The new brand system
CloudBees is a trusted partner, always seeking and sharing knowledge with our customers, but also innovating and pushing boundaries to create continuous improvement in software development. Most importantly, we are humans and not robots—it was important for us to be open and approachable. So, we evolved our brand personality to reflect our passion, expertise, and agility. Our voice is approachable, knowledgeable, confident, and inspiring, with a glint of light-hearted humor as and when called for.
The new brand expression builds on the foundation of our redefined vision, mission, and values with a uniform brand expression you’ll see reflected in our words, illustrations, photographs, creative choices, and all that we do moving forward.
We’re just getting started: “Let’s go!”
When we embarked on this project, we knew that the timeline was ambitious. We as a team are proud of the work we did in just a short few months. But this is just the beginning. You will see our brand percolate in everything we do from our website and events to our products and every single interaction with you, our customer.
Let’s make a difference in DevOps together. Come, join us!