

*article updated on September 30, 2024
What’s the first thing you think of when someone refers to continuous integration (CI)? For many people, it’s Jenkins®. Originally developed just for CI, Jenkins manages and controls software delivery processes throughout the entire lifecycle. It’s now the most widely used software process automation, continuous integration and continuous delivery tool in the world.
This tutorial focuses on CI. You’ll learn how to build a Jenkins server and create a CI job. Then you’ll finish up by starting an automatic build as the result of a code change.

What Is CI (Continuous Integration)?
CI means integrating code quickly. Rather than operating on a schedule or waiting for the project to cross predefined gates, developers frequently push their changes to a shared repo. Then, Jenkins or another similar tool detects the changes and starts a build.

There are many reasons to implement CI. When you integrate and build your code early and often, it helps you detect problems and conflicts early on, rather than weeks or even months after they’re created. You also help your developers by getting the feedback earlier too.
What Is Jenkins and What Does It Do?
Jenkins is an open-source automation server. You can use it to automate nearly any task. Most importantly, you can also trigger these tasks based on events like changes to a source code repository. That’s what makes it a powerful tool in the software development process.
Let’s get Jenkins up and running quickly!
How to Start the Jenkins CI Setup
The fastest way to get started with Jenkins is with the latest Docker image. It contains everything you need to get a server up and running. So you’ll need a system with Docker installed.
You’re also going to use Docker Compose to add a Jenkins agent to the server, so you’ll be able to set up a simple project.
Finally, you’ll need access to a Git repo. For this example, I’ll use one on GitHub, which you can fork and use for this tutorial.
Installing and Configuring Jenkins
Setting Up Your Jenkins Server
First, you need to start a Jenkins server and unlock it.
Create an empty directory. Then create a file named docker-compose.yaml with your favorite text editor.
Here is the initial configuration.
# docker-compose.yaml
version: '3.7'
services:
jenkins:
image: jenkins/jenkins:lts
privileged: true
user: root
ports:
- 8080:8080
- 50000:50000
container_name: jenkins
volumes:
- /jenkins_compose/jenkins_configuration:/var/jenkins_home
The service, which starts on line three, is the Jenkins server. It has several important properties.
image: You’re using the latest long-term support Jenkins image.user: Jenkins will run as root in the container.ports: The server will listen on port 8080 for web connections. The other port is for build agents.container_name: Rather than using a randomly generated container name each time you run the service, set it to jenkins.volumes: This volume stores configuration data so it survives restarting the container. Use a local path on your system.
Start this container with docker-compose up -d in the directory where you placed the configuration.
egoebelbecker@zaku:~/jenkins_compose$ docker-compose up -d
Creating jenkins ... done
You can verify that your container is running with docker ps.
egoebelbecker@zaku:~/jenkins_compose$ docker ps -a
CONTAINER ID IMAGE COMMAND
CREATED STATUS PORTS
NAMES
fcfe73288011 jenkins/jenkins:lts "/sbin/tini -- /usr/…"
About an hour ago Up About an hour 0.0.0.0:8080->8080/tcp,
0.0.0.0:50000->50000/tcp jenkins
You’ll see a container named jenkins.
Next, point a web browser at your server. If you can run on a browser on the same host, point your web browser at 127.0.0.1:8080. If not, use the IP address of your Docker server.
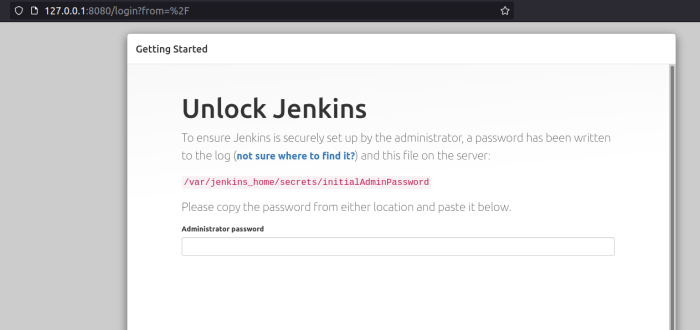
You need the password from the log to unlock that server. So go back to the prompt and run docker logs jenkins. Look for three lines of asterisks and a message like this:
2021-06-12 23:53:23.868+0000 [id=34] INFO
jenkins.install.SetupWizard#init:
*************************************************************
*************************************************************
*************************************************************
Jenkins initial setup is required. An admin user has been created and a password generated.
Please use the following password to proceed to installation:
2df2903029634350a69d0b05a5af17fe
This may also be found at: /var/jenkins_home/secrets/initialAdminPassword
*************************************************************
*************************************************************
*************************************************************
Copy the password, paste it into the prompt, and click the “Continue” button on the bottom of the page. This takes you to the plugins page.
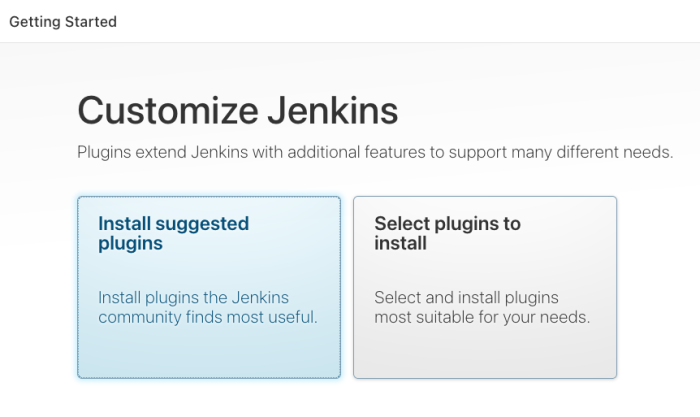
Click “Install suggested plugins,” and wait for them to finish installing. Next, the installation prompts you for an admin user.
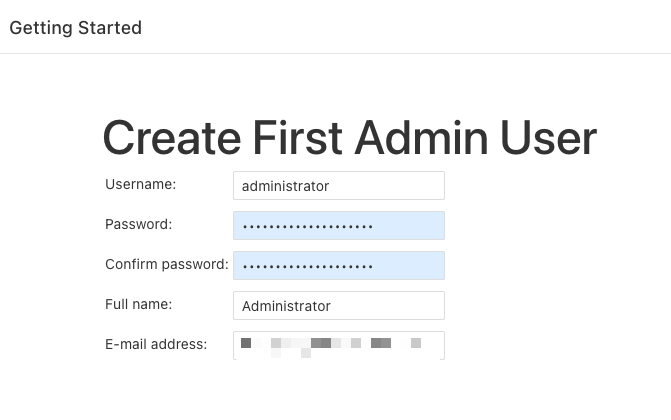
So enter information for the administrator login.
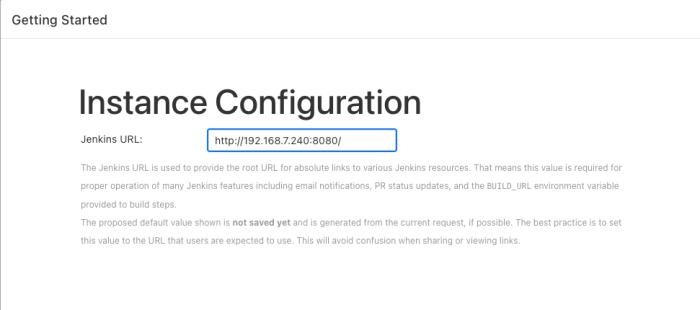
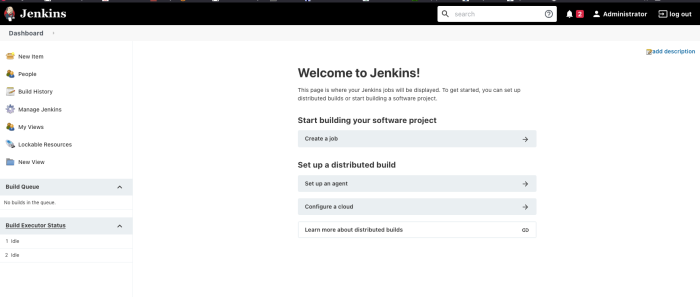
You now have a Jenkins server!
Creating a User
Click through the next couple of pages, and you’ll end up on the main dashboard.
Now, create an unprivileged user since you don’t want to run builds as the administrator.
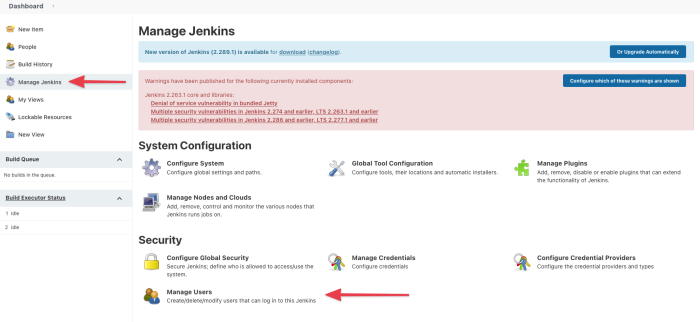
Click on “Manage Jenkins.” Then on “Manage Users.” This takes you to the user page.
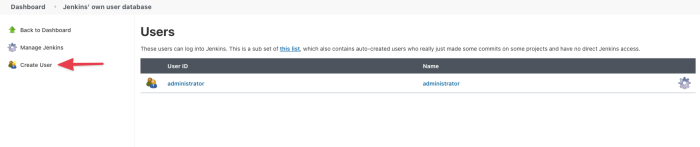
Next, click on “Create User.”
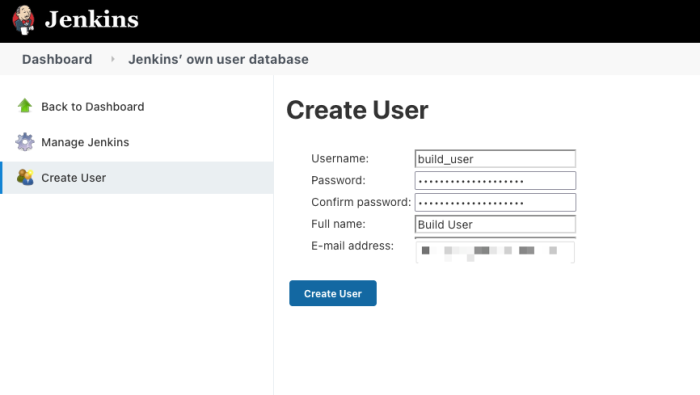
Fill in your new user’s information and click “Create User.”
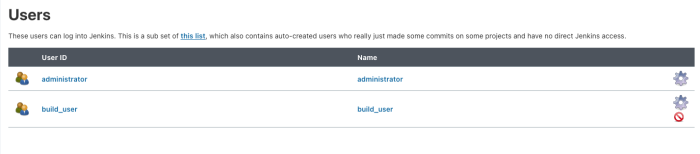
You’ve added an unprivileged user. Now, it’s finally time to create a new CI job.
Add a CI Job
Git Repository
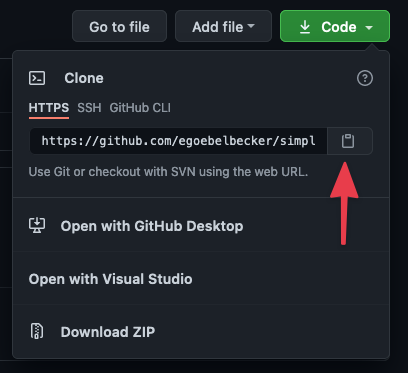
To set up a CI job, you need a Git repo for Jenkins to pull code from. For this tutorial, I’ll use a URL for a publicly accessible repository. Fork this repo so you can make changes for the automated build test.
Once you’ve forked the repo, get the URL.
Add the Job
Before you add your first build job, log out of Jenkins and log back in as your new user.
Then, click “Create a job” in the center of the dashboard.
This takes you to the item entry page.
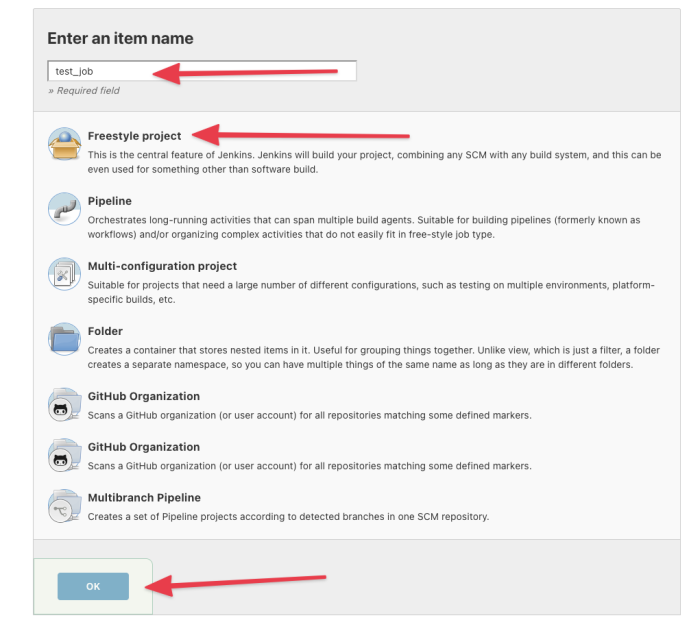
Give your job a name. Select “Freestyle project.” Then click “OK.”
Now you’re on the job detail page. Start at the “Source Code Management” tab.
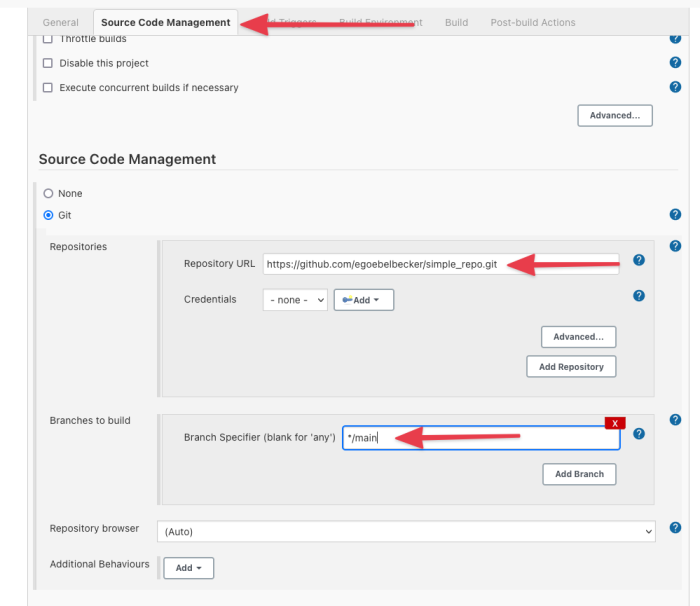
Enable Git under “Source Code Management.” Then add your repo URL and set the “Branch Specifier” to /main since that’s the default branch for a new GitHub repository.
Next, go to the “Build” tab and find the “Build” section of the job details page.
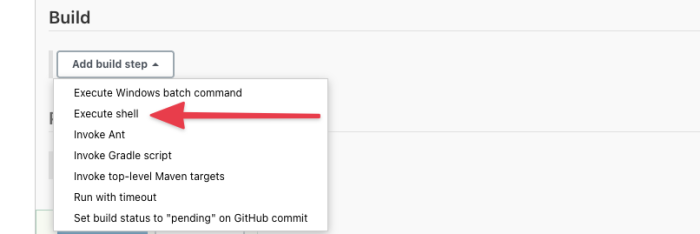
Click the “Add Build Step” button. This will open a menu where you can select from several options. Select “Execute shell.”
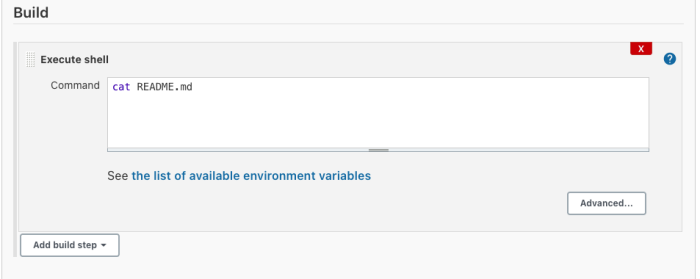
Enter cat README.md into the test area. This is the shell command Jenkins will execute for each CI job.
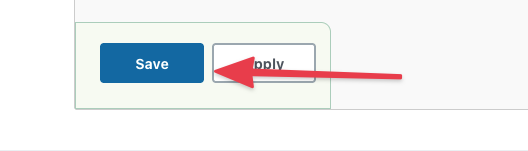
Click “Save.”
You’ve created a build job.
Run a Build Job
So let’s run the build and see what happens.
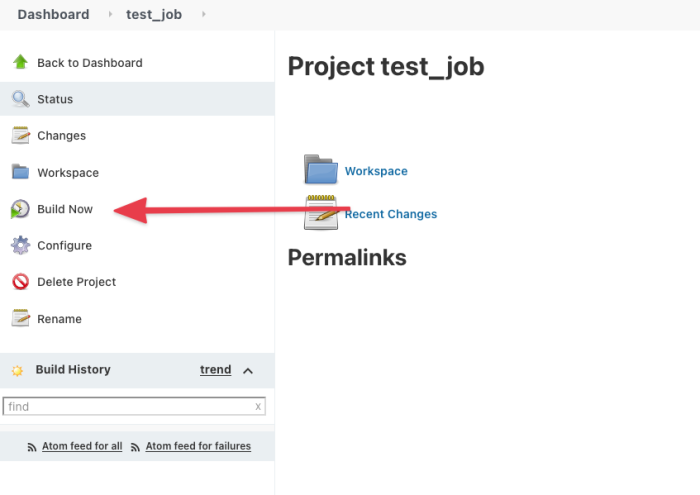
When you saved the job, Jenkins took you to the job status page. You can manually kick off a build by clicking on “Build Now.”
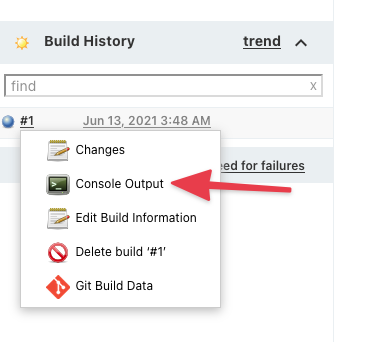
This build only takes a few seconds to run. When it finishes, you’ll see the build number in the “Build History” area.
Click on the build number and select “Console Output.”
The console output is plain text, but a few key lines are in bold here. They won’t be on your server.
Started by user Build User
Running as SYSTEM
Building in workspace /var/jenkins_home/workspace/test_job
The recommended git tool is: NONE
No credentials specified
Cloning the remote Git repository
Cloning repository https://github.com/egoebelbecker/simple_repo.git
> git init /var/jenkins_home/workspace/test_job # timeout=10
Fetching upstream changes from https://github.com/egoebelbecker/simple_repo.git
> git --version # timeout=10
> git --version # 'git version 2.11.0'
> git fetch --tags --progress -- https://github.com/egoebelbecker/simple_repo.git +refs/heads/*:refs/remotes/origin/* # timeout=10
> git config remote.origin.url https://github.com/egoebelbecker/simple_repo.git # timeout=10
> git config --add remote.origin.fetch +refs/heads/*:refs/remotes/origin/* # timeout=10
Avoid second fetch
> git rev-parse refs/remotes/origin/main^{commit} # timeout=10
Checking out Revision 45b6ec68d90e3235b3474c3d827394e0715a7df2 (refs/remotes/origin/main)
> git config core.sparsecheckout # timeout=10
> git checkout -f 45b6ec68d90e3235b3474c3d827394e0715a7df2 # timeout=10
Commit message: "Update README.md"
First time build. Skipping changelog.
[test_job] $ /bin/sh -xe /tmp/jenkins1484436943644585798.sh
+ cat README.md
# simple_repo
This is a dummy repo with only a README.md file.
Finished: SUCCESS
You can see that Jenkins checked out the repository and then ran the build. Since our build simply prints out the readme file, it passes.
Trigger a Build Job
This takes care of the first part of CI—automatically building code. Now to add the most important step: building when the repository changes.
Click “Configure” and go to the “Build Triggers” tab.
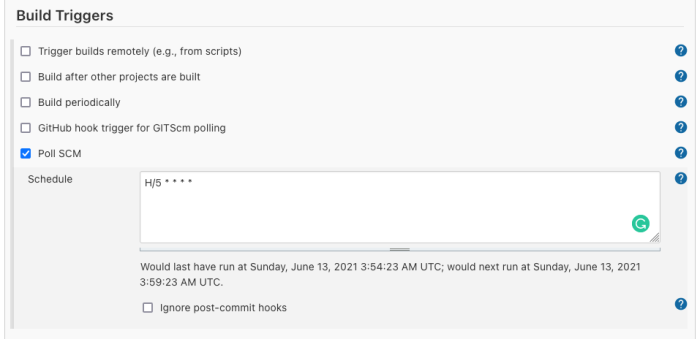
Select “Poll SCM.” This will poll GitHub periodically for changes. Enter the schedule above. This entry tells Jenkins to check for changes every five minutes.
Now, edit the README.md and commit and push the change.
After a few minutes, Jenkins will start another build. When it finishes, take a look at the build log.
Note: Learn more about the git pull command to ensure your local repository stays in sync with the remote.
Started by an SCM change
Running as SYSTEM
Building in workspace /var/jenkins_home/workspace/test_job
The recommended git tool is: NONE
No credentials specified
> git rev-parse --resolve-git-dir /var/jenkins_home/workspace/test_job/.git # timeout=10
Fetching changes from the remote Git repository
> git config remote.origin.url https://github.com/egoebelbecker/simple_repo.git # timeout=10
Fetching upstream changes from https://github.com/egoebelbecker/simple_repo.git
> git --version # timeout=10
> git --version # 'git version 2.11.0'
> git fetch --tags --progress -- https://github.com/egoebelbecker/simple_repo.git +refs/heads/*:refs/remotes/origin/* # timeout=10
> git rev-parse refs/remotes/origin/main^{commit} # timeout=10
Checking out Revision 6ff95003904841c2a8664598a3a052a3efce13ea (refs/remotes/origin/main)
> git config core.sparsecheckout # timeout=10
> git checkout -f 6ff95003904841c2a8664598a3a052a3efce13ea # timeout=10
Commit message: "Updating readme to trigger a build."
> git rev-list --no-walk 45b6ec68d90e3235b3474c3d827394e0715a7df2 # timeout=10
[test_job] $ /bin/sh -xe /tmp/jenkins809505298264427884.sh
+ cat README.md
# simple_repo
This is a dummy repo with only a README.md file.
This change should trigger a build.
Finished: SUCCESS
The build console shows the latest commit message and the successful build results.

Learn More About Jenkins
In this tutorial, you set up a new Jenkins server using Docker and Docker Compose. After completing the basic server configuration, you set up a new build job. You ran the job manually and then configured a CI job by telling Jenkins to start a new build every time the repository changes.
With its ease of use and nearly unlimited power, it’s easy to see why Jenkins is so often used for CI. If you’re not already using it to control your CI pipelines, take a look and see how you can speed your integrations and make life easier for your developers.
If your team uses Jenkins and you'd like to learn more about managing and scaling it for the enterprise, check out this eBook.
This post was written by Eric Goebelbecker. Eric has worked in the financial markets in New York City for 25 years, developing infrastructure for market data and financial information exchange (FIX) protocol networks. He loves to talk about what makes teams effective (or not so effective!).