

Updated on April 20, 2025
It's critical to collect the right data at the right moment to diagnose a performance instability period during the application lifecycle. Kubernetes adds complexity to this task while increasing the reliability and uptime of modern applications. This post talks about the key Kubernetes concepts needed for troubleshooting a Jenkins performance incident and how to use CloudBees support tools and CloudBees CI's APM features to tackle it.

This is a series of posts which consists of two articles:
- Part 1 discusses the need of using APM tools for troubleshooting performance issues, the particularities of performance management for Jenkins running on Modern Platforms and different approaches for data capture: traditional vs. modern.
- Part 2 details how to use Jenkins own-built APM features when there is not an external dedicated service for it.
The demo content for this post series (scripts and pipeline code) are stored in cloudbees-oss/pipeline-home-demo (tag/release: performance)
Data-Driven Insights for Jenkins Performance: APM Tools
“Just like human beings, Jenkins benefits from periodic health check-ups. It helps you establish baselines if you develop performance problems later, and sometimes it even lets you discover a problem and nip it in the bud before it becomes a serious one.” (Kohsuke 2013, Health check your Jenkins).
It's now almost a year ago since Ryan Smith analyzed JVM tuning (mainly focused on Garbage Collector) for CloudBees CI in Enterprise JVM Administration and Jenkins Performance for traditional platforms. For modern platforms the GC settings are still valid but some adjustments will be introduced regarding the memory configuration for container environments.
OK, so if my Jenkins has the “magic” JVM settings, then it will run happily and healthily for the rest of its life.
Oh Yeah... That's not gonna happen…
Jenkins, like any application in a production environment, is exposed to a series of potential threats that could damage its performance by impacting at least one of the following metrics:
- CPU load
- Memory Heap
- Disk Input/Output (Jenkins stores everything into the filesystem: JENKINS_HOME)
- HTTP requests time
- Ingress or Route controller (so performance can be compared between the ingress/route and the Jenkins controller service behind it.
The list of potential threads listed for CloudBees CI also applies in the context, but I’d add other elements to that list, such as:
- Unhealthy nodes (see Troubleshooting steps for diagnosing an unhealthy Kubernetes node)
- Misconfiguration of request and limits, as well as health checks for containers
APM reports set a common data-driven language for troubleshooting performance incidents between Jenkins admins and support engineers. Ideally, when a Jenkins admin wants the support team to investigate an specific incident (alert), he/she would share the violated rule description plus performance data to understand how the application behaves in a healthy state and how it was behaving during the reported outage (unhealthy).
On the other hand, if the only information available is the observed symptoms from their end-users (“the Jenkins UI is running slowly a couple of days ago, Jenkins is not building jobs as fast as it used to”, ...) a Support Bundle might be not enough to diagnose the issue after we validate:
- The application meets with the JVM best practices (about.md file)
- The application is not impacted by any of the performance issues caught by Jenkins Health Advisor by CloudBees reports.
- Number of jenkins items to get a picture of the workload (items.md file)
- Within the outage time frame
- The garbage collection logs (nodes/master/logs/gc folder) report from tools like gceasy.io
- The more time consuming slow requests (slow-requests folder). Is there any deadlock record (deadlock folder)?
- Is there any memory exceptions controller node in the dmeg (nodes/master/dmesg.txt file) or jenkins logs (nodes/master/logs folder)?
Key Metrics Providers
From the infrastructure to the application level:
- Cloud vendor metrics (For example GKE metrics)
- Kubernetes metrics
- Jenkins metrics
It is important to highlight that there are some metrics overlapping with one another. For example, with the help of Kubernetes labels, you can monitor Memory and CPU of your Jenkins containers using Kubernetes metrics and you don’t need to use Jenkins Metrics. On the other hand, you cannot watch disk input/output metrics with Jenkins Metrics; you have to monitor them at the infrastructure level.
Monitoring Kubernetes Performance Issues
Kubernetes Service vendors offer their own solutions to monitor Kubernetes Metrics out-of-the-box. For instance, Google Kubernetes Engine offers a set of monitoring tools (powered by Google Cloud Monitoring).
For Jenkins Metrics monitoring, the most popular options are:
- Integrations with
- Datadog (push to service). It can be also configured via enabling JXM agent, avoiding the overhead in the Jenkins JVM (CloudBees CI example)
- Prometheus (pull from service). It is used in combination with Grafana for visualization which offers a list of built dashboards for Jenkins performance
Note: Jenkins Metrics can be combined with other metrics providers.
- Jenkins own-built features
- Monitoring (own-built) using Java Melody for reporting
- CloudBees Monitoring (proprietary) for alerting
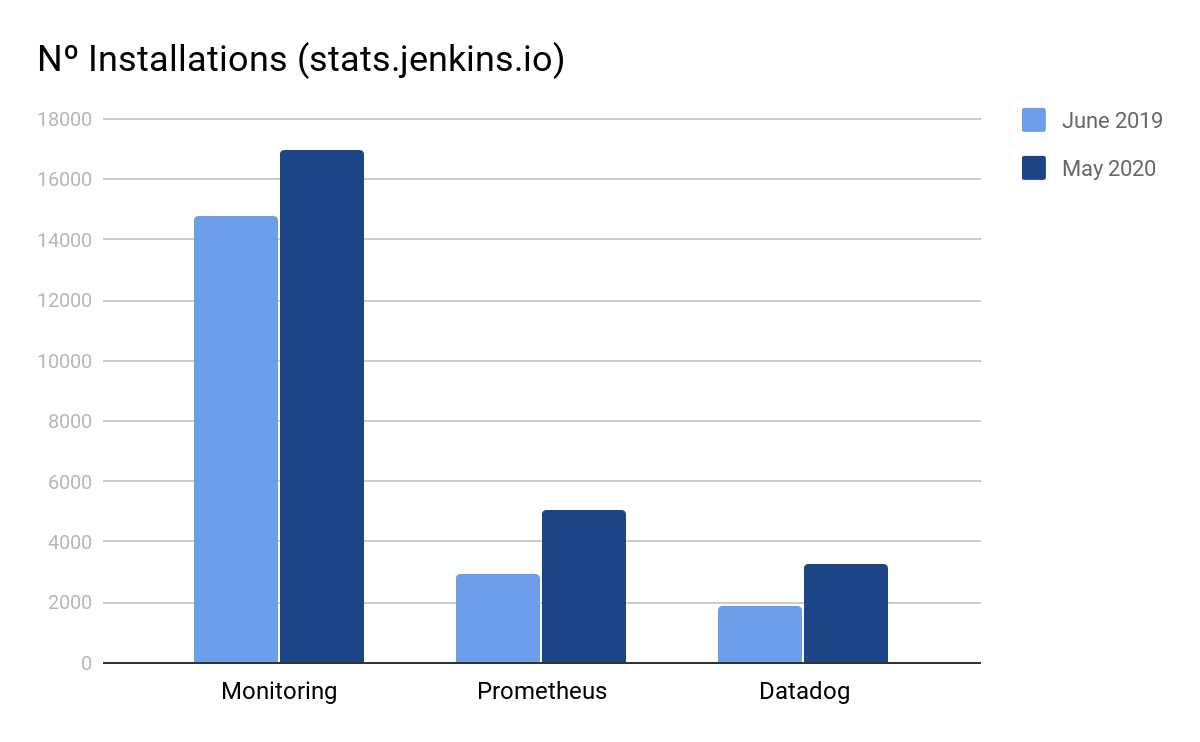
Figure 1: Number of installation monitoring plugins for Jenkins. Data extracted from stats.jenkins.io for June 2019 and May 2020
Deploying Jenkins in Kubernetes
Let’s start this section by saying that CloudBees CI is the standard way to deploy Jenkins in Kubernetes at the enterprise level.
Sizing Kubernetes Nodes to Improve Jenkins Performance
The computing capabilities of a Kubernetes cluster are defined by the cluster's nodes (physical or virtual machines); a pod is deployed by the Scheduler on an assigned node that meets its container resources requirements; and containerized applications run inside a pod.
Once your controllers are compliant with the controller sizing specifications, enabling autoscaling (e.g in GKE) in combination with other strategies like taints tolerations or node affinity is the way to ensure that your container does not run out of resources.
Managing Kubernetes Container Resources to Prevent Jenkins Performance Issues
Containers’ requests and limits are the mechanisms that Kubernetes uses to control resources: CPU and memory. Requests are what the container is guaranteed to get. If a container requests a resource, Kubernetes will only schedule it on a node that can give it that resource. Limits, on the other hand, make sure a container never goes above a certain value. The container is only allowed to go up to the limit, and then it is restricted.
CPU is considered a “compressible” resource. If your app starts hitting your CPU limits, Kubernetes starts throttling your container. This means the CPU will be artificially restricted, potentially giving your app worse performance! However, it won’t be terminated or evicted. In this context, adding a liveness probe ensures your application uptime because Kubernetes restarts the offending pod when it detects that the app is no longer serving requests.
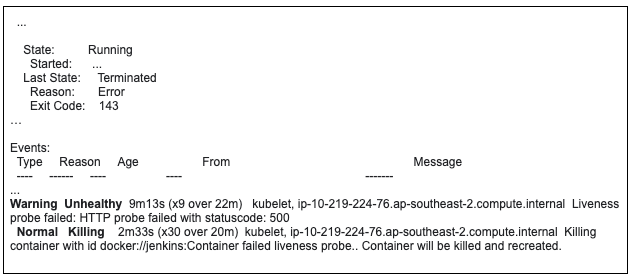
Figure 2: Example of Kubernetes events for a Jenkins pod related to kill signal from a failed liveness probe
Unlike CPU resources, memory cannot be compressed. Because there is no way to throttle memory usage, if a container goes past its memory limit it will be terminated: SIGKILL (Kubernetes OOM kill).
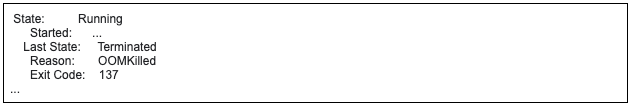
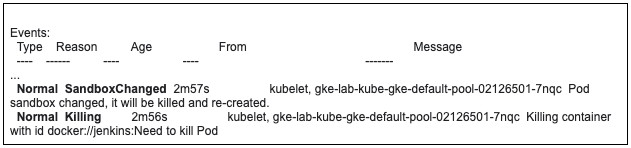
Figure 3: Example of Kubernetes last state and events for a Jenkins pod related to a OOM kill
Optimizing Data Capture Regarding Jenkins Performance
Troubleshooting a performance issue requires a series of concatenated processes:
- Capture of the data depending on the issue
- Analysis to establish a hypothesis based on pieces of evidence
- Applying mitigation measures.
After applying the proposed fix, the instance behavior is monitored to assess (feedback) the stability of the application. If it is still unstable, the above steps are repeated.
Generally speaking, the golden rules for data capture are:
- What? Get the right data. CloudBees Support has documented a series of articles to collect the minimum data to start working on troubleshooting different topics in our required data section. In this post, we are focusing on CPU and memory issues.
Since CloudBees releases cbsupport CLI, the data capture process is being moved from a list of manual steps to one single command automatic collection
- When? “At the right moment, the issue is exposed.” If you are a CloudBees customer, you are familiar with that sentence if you have opened a performance case :). Basically, there are two ways Jenkins' performance instability is visible: traditional vs. modern approach.
Traditional Troubleshooting Approach: Identifying Kubernetes Slow Performance
A CloudBees customer opens an urgent case to contact Support to report a Jenkins Service Outage in a production environment. This approach is the standard for CloudBees CI on traditional platforms, but it is also common for modern platforms when a Jenkins container remains in running status and keeps restarting.
Then Developer Support Engineers (DSE) helps the Jenkins admin to proceed quickly with the Data Capture, before the Jenkins Server is restarted by using required-data performance or required-data memory. Increasing temporarily the Timeout for Probes or memory limits could spot the bottom of the issue in this context.
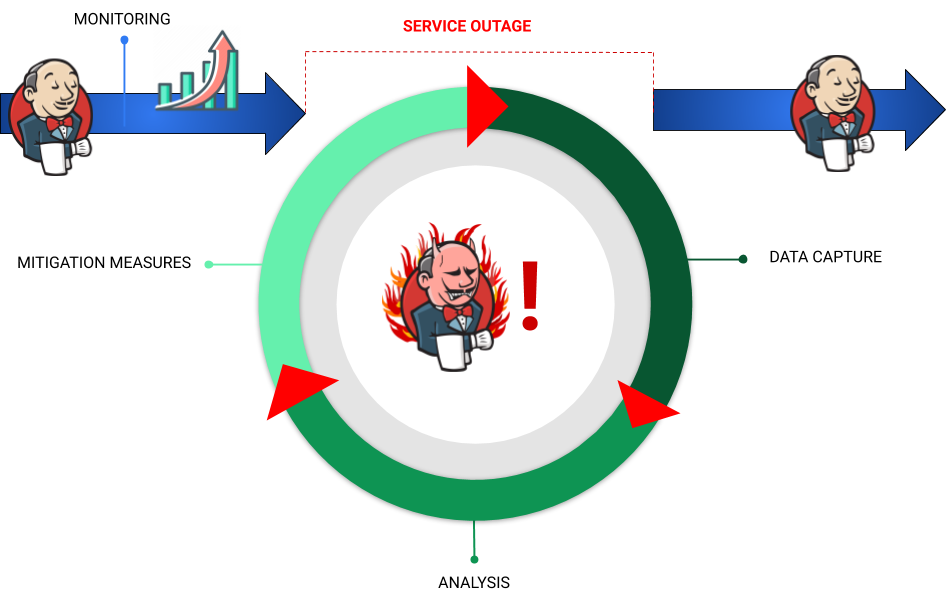
Figure 4: Diagram representing the troubleshooting process traditional approach
In parallel, we want to monitor the resources consumption during the outage for impacted Jenkins pod (e.g. cjoc-0). Hopefully there is an APM service which monitors Jenkins containers but what about if it is not the case? We need do it via command line.
- kubectl by running a script based on kubectl top for nodes, pods and containers (demo: kubectl_monitoring.sh). In addition, monitoring the status of the nodes (kubectl get nodes --watch) and pods (kubectl get pods -n cje-support-general --watch) is recommended.
- Once you ssh into the node where cjoc-0 is running:
- docker: docker stats
- linux htop or top (in the case none of the previous options are available)
Modern Troubleshooting: Managing Resource Peaks in Kubernetes for Jenkins
Since the Kubernetes era, we have observed differences in the way customers open a performance case in our Support channel. Normally, Jenkins admin receives an alert notification (or a full monitor report) from their favourite APM tool showing some kind of Jenkins instability. However, their end-users rarely report a service outage.
Kubernetes restarts pods in case of an OOM killed event or a failure with liveness/readiness probes. This mechanism increases the availability and uptime of the CI/CD web service but masks the origin of the performance issue that keeps impacting the application execution. The solutions do not come necessarily from increasing the computing resources in the node pool and/or assigning more resources to the unstable container, but rather from mitigating the root cause.
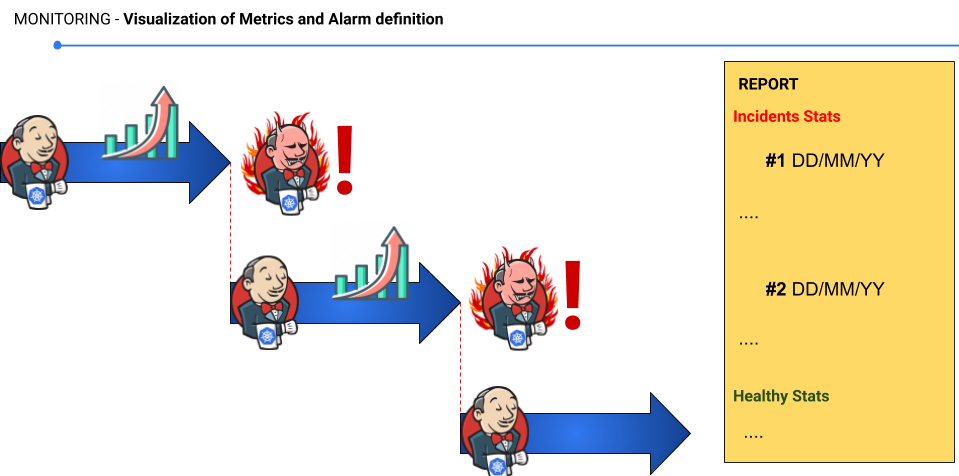
Figure 5: Diagram illustrating the restarting process by Kubernetes after OOM SIGKILL or failed probe
Syncing Alerts and Data Capture
How can you sync data capture with the performance incident? Extend the alert settings within your favorite APM tools, not only to notify the Jenkins admins when a defined rule for a certain metric is violated but also to trigger the data capture at that right moment. The implementation of this approach depends on the APM tool of your choice. Some examples:
- Scripts and Alerts for Java Melody
- Prometheus-am-executor for Prometheus
- Webhooks integrations for Datadog
In Part 2 of this series, we will be using Jenkins Pipelines triggered by CloudBees Monitoring.
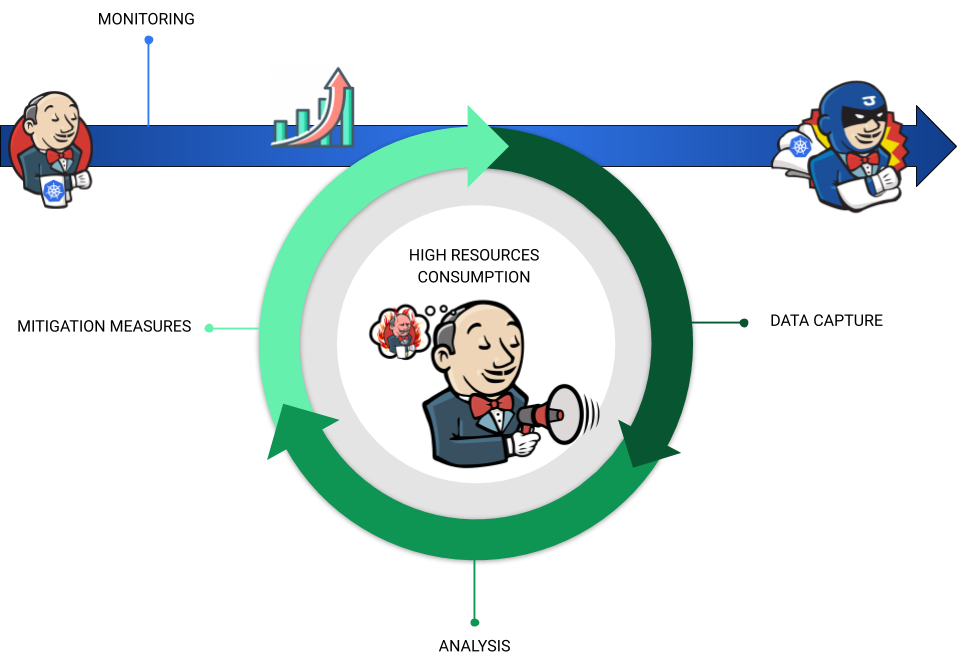
Figure 6: Diagram representing the Troubleshooting process modern approach
About Carlos Rodriguez Lopez:
Carlos is a Lead DevOps Support Engineer at CloudBees, with a background in Java web development and tooling for data analysis. "Never stop learning" is his professional mantra. Check out his GitHub Profile.
Learn more about managing and scaling Jenkins for the enterprise with this eBook.