As ecosystems such as the Yocto Project mature and become more popular for embedded device development, usage of the underlying BitBake build tool is increasing. BitBake is a powerful tool used to manage, build, and integrate complete operating system images through package and distribution management activities such as fetching of source code, configuration, cross-compilation, installation.
As with all software build systems, BitBake speed and performance are of utmost importance and a key enabler of productivity and quality. We have validated this multiple times through discussions with customers over the years. We also validated this with key contributors and users in the Yocto and BitBake communities, where there are ongoing discussions about what can be done to improve performance.
So a valid question is, can we understand how a BitBake build currently behaves and from that, determine if, and pinpoint where, there are opportunities for improvements? The answer is a resounding YES.
In this Yocto build tutorial we will explain our process of understanding Yocto BitBake build performance and provide some useful utilities that we hope the BitBake community will benefit from as the never-ending quest for additional build performance continues!
Basic BitBake performance visualization with buildstats-plot.sh
After following the Yocto Project Quick Start guidelines and some exploration of the BitBake build process and its artifacts, we notice a folder called buildstats under ${TOPDIR}/tmp. This folder has the below structure:
buildstats/[target architecture] (e.g. core-image-sato-qemux86)/[timestamp]/[packages]/do_compile do_configure::do_unpack
An examination of one of these do_[task] files (e.g. do_compile) reveals a lot of interesting data:
>cat do_compileEvent: TaskStartedStarted: 1367381613.31xkbcomp-1.2.4-r8.0: do_compile: Elapsed time: 3.25 secondsCPU usage: 23.3EndIOinProgress: 0EndReadsComp: 0::StartTimeWrite: 1725266628StartWTimeIO: 1725869092StartWritesComp: 0Status: PASSEDEnded: 1367381616.57
For each task we can get start time, end time and a bunch of other potentially useful data points. Interesting!
The BitBake and Yocto Project communities have already created some profiling and analysis utilities using this data.
The BitBake utility called buildstats-plot.sh tool generates static graphs of aggregate time spent per task-type or time spent per package. The oe-build-perf-report lets you mine performance data – and justify a lunch break or game of ping pong while it fetches data. Interesting, yes – but not very insightful and helpful if you need to dive deeper into what’s actually going on with your build. Where are the build bottlenecks? How do we pinpoint opportunities for improvements?
Using ElectricInsight to Visualize and Understand BitBake Build Performance
ElectricInsight is a powerful tool for build optimization, troubleshooting, and analysis. Is there a way to leverage ElectricInsight and the buildstats data to visualize and understand BitBake build behavior and performance? With ElectricAccelerator 11.0, we included a conversion utility called bb2anno that transforms BitBake buildstats data into an ElectricInsight-compatible annotation file. We can then use that data to uncover actionable takeaways such as when, and in what sequence, particular tasks are run, effects of BitBake concurrency, and overall task-by-time reporting.
Generating an ElectricInsight annotation file from BitBake build stats is done with the bb2anno utility, available as part of the ElectricAccelerator 11.0 installation (in the /opt/ecloud/i686_Linux/unsupported/ directory by default).
Following is the bb2anno command usage, where the -annoroot command is ElectricAccelerator specific and should be excluded for native BitBake visualization:
bb2anno -id <BUILDNAME> -annoroot <path_to_anno_files> -buildstats <path_to_buildstats> -buildlogs <path_to_build_logs>
The following example shows how to enter the bb2anno command to generate an ElectricInsight annotation file for a native BitBake build:
~/bb2anno -id 99937022 -buildstats tmp/buildstats/20181212102014/ -buildlogs tmp/work > combined_99937022.anno
A Real World Example
The best examples are from the real world, so we’re going to use a publicly-available Raspberry Pi Yocto BitBake build, as a reference to see what performance insights ElectricInsight can provide. In the example below we get an at-a-glance overview of the build details: total build duration, level of parallelization, and a timeline of how, when and where the individual jobs ran.
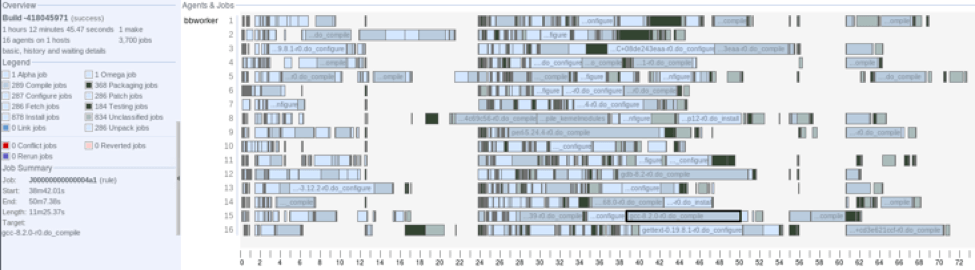
We can see that the build took 72m46s to complete, is using 16-way parallelization, and is composed of 3700 different jobs (i.e. BitBake tasks). Due to BitBake dependency serialization, we note there are significant sections of “whitespace” at about 12m and at about 52m. It is also easy to identify the longest tasks of the build, which suggest potential candidates for optimization.
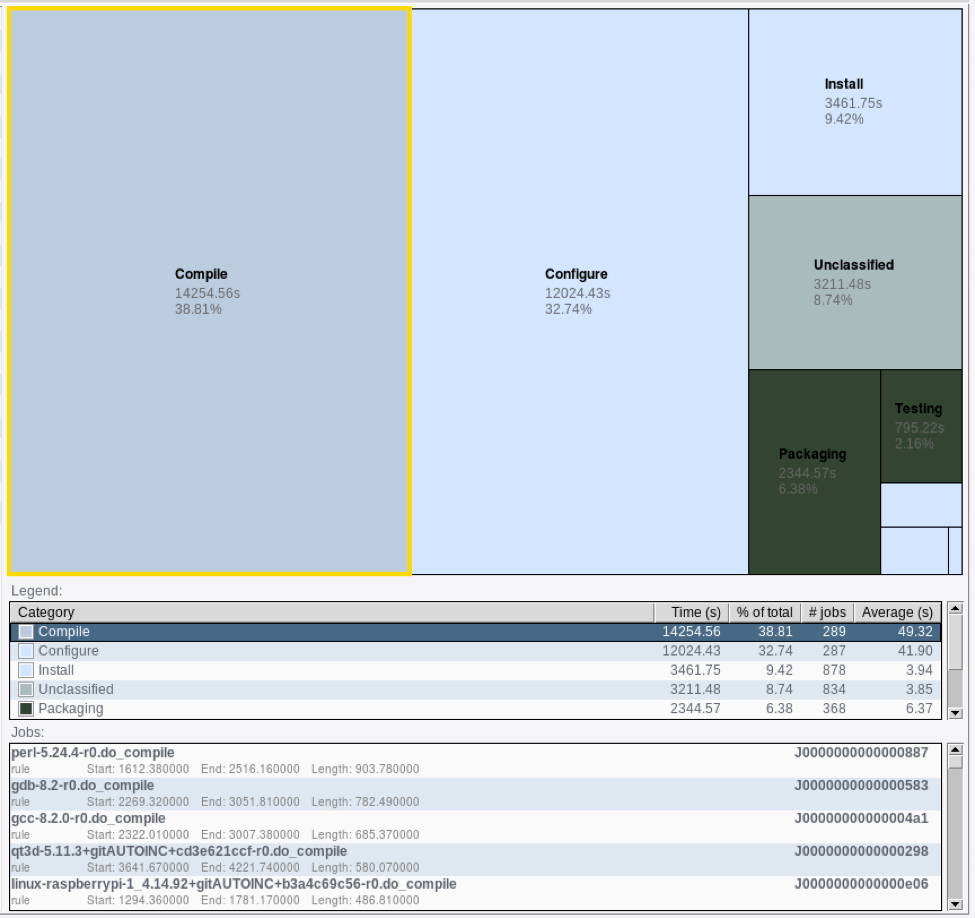
Advanced BitBake Build Visualization with ElectricInsight
ElectricInsight has a built-in report that can be used to visualize a heat map of where your build is spending its time, called the “Job Time By Type” report. Let’s take a look at what we get from our Yocto BitBake build: