WebRTC is an amazing and rather ground-breaking technology pioneered by those geniuses at Google. Enabling plugin-free connectivity between browsers, the typical application for WebRTC is that of video chat applications.
However, WebRTC is not just for audio and video; it's also capable of transmitting other high-speed data. In short, envision a future of peer-to-peer gaming, file transfer, and other true serverless applications.
The Dark Side of WebRTC
While working at Xirsys, I have seen some pretty amazing applications utilizing WebRTC technology. There certainly are some very inspiring developers around. But while some folks are coding the next greatest invention, a majority of developers are struggling to get started. Why? Simply because WebRTC is hard!
We're all familiar with the typical web application. We have a client that sends and receives data to a server and a server application that sends and receives data to a database. The processes of many web apps are linear and predictable. If something goes wrong, we usually know where to look and why it may be happening.
WebRTC, however, is not so straightforward.
Asynchronous
If you've ever written a multi-threaded application, you're aware of some of the headaches that can ensue. Race conditions and corrupt data are just a couple, but it usually always boils down to problems that are hard to find and fix.
WebRTC is asynchronous by nature. It has to be, given the context of sending and receiving data from a remote machine. This is not the same kind of asynchronism that one might consider of AJAX calls; those are most certainly simple by comparison. Instead, think of it in terms of many such calls layered on top of a changing landscape of local and remote data.
Certainly not for the faint-hearted.
Predominantly client-side
WebRTC is a client heavy technology. When client apps don't work, the usual first step is to ask the TURN service provider if there are any logs that show why it didn't work.
However, it should be noted that the greatest majority of WebRTC failures occur when the server was never even contacted. No contact means nothing to log, at least from a server's perspective. This means having to dig into your own code to find the answer and knowing where to begin looking.
NAT traversal mine field
Building web apps is typically a simple endeavor. You write something that will sit behind a web server. This may or may not have server-side logic. Once written, you deploy to your server.
At such times, the worst thing that might happen is that you forgot to open the correct ports in the IPTables. We've all done it. It's usually simple to sort out. Things aren't quite so easy with WebRTC.
The issue here is that web servers themselves (the hardware, not the software) are deployed with the intention of serving data publicly. They have network hardware configured to this end and provide a public IP address. However, with WebRTC, the intention is to connect and send and receive data from users' machines.
Such machines are typically situated on networks designed to protect said machines from public requests, may not have a public IP address, and often introduce complicated hurdles.
While connecting to a simple web server is as easy as making an HTTP request, WebRTC provides a multitude of connection types, each of which may be tried in order to establish a successful connection.
Where to Start with WebRTC Debugging
There are several ways to approach debugging WebRTC apps and a few important tools to have in your arsenal. We'll address the most important tools here, while covering typical problem scenarios that occur for most developers starting out with WebRTC.
Before we get too involved in this, however, let's take a look at the typical WebRTC connection process.
WebRTC connection process
All WebRTC connections require a little help from a signaling protocol. This is simply a fancy way of saying you need to introduce a third-party communications protocol to allow the exchanging of data between the caller and the callee.
This data includes information about each machine's browser audio and video capabilities as well as some information about the network the machine is connected to. This info is used to configure the WebRTC connection options and stream types.
Typical technologies for this information share include COMET and Web Sockets. However, you can use any technology you choose. You could even opt for two tin cans joined with string and enter the data manually, if you so choose, but I would recommend against that option.
With your signaling tech in place and connected to both users' machines, you can begin the process of initiating the WebRTC connection.
Offer and answer
WebRTC connections are initialized through the use of offers and answers. From an objective perspective, this reads as:
- The Client sends the Peer an offer to connect.
- The Peer receives the offer to connect.
- The Peer sends the Client an answer.
- The Client receives the Peer's answer.
This all seems more like polite etiquette. I mean, who would want someone to just start talking through their browser without accepting an offer first?
In reality, however, there is more to this exchange of formalities.
- Prior to sending the offer to connect, the Client creates an instance of the
RTCPeerConnectionobject and produces an SDP (Session Description Protocol) packet, using: rtcPeerConnection.createOffer()- This details the media capabilities of the Client's machine and browser.
- The SDP packet is then set as the Client's local description via the
setLocalDescriptionmethod of theRTCPeerConnectionobject. - The SDP packet is then sent to the Peer, which sets this as the remote description via the
setRemoteDescriptionmethod of theirRTCPeerConnectionobject instance. - The Peer then generates its own SDP packet using the
RTCPeerConnectionobject'screateAnswermethod and sets it as its local description. - The Peer sends the SDP packet to the Client as the answer response, which it sets as its remote description.
At this point, both Client and Peer are aware of the other party's session potential.
ICE candidates
Both parties are now aware of each other's media capabilities, but not much has been said of the network. This, too, is the responsibility of the RTCPeerConnection object.
However, while media information is relatively instantaneous to acquire and of a linear description, the network capabilities are usually numerous and take a little time to acquire. For this reason, the network details are sent ad-hoc as they are known.
Now, to highlight the confusing nature of WebRTC, connectivity between Client and Peer can begin as soon as the first candidate is sent but may not be established until an acceptable candidate is processed. This is known as Trickle ICE and is a means to establish connectivity as soon as possible. Essentially, all connectivity options will be tried and exhausted until one succeeds.
The network SDP packets are acquired by the initiating machine using the RTCPeerConnection object's onicecandidate handler (notice it's all lowercase) and sent via the signaling to the other party, which assigns it to its own RTCPeerConnection instance via the addIceCandidate method (yes, that one has capital letters. Sheesh!). As expected, the reverse also happens.
Connectivity happens when a suitable network pair match and data flows.
Connectivity
In order to create the connection, WebRTC uses what is known as STUN (Session Traversal Utilities for NAT) and TURN (Traversal Using Relay around NAT).
These sound rather complex but are actually quite simple protocols oriented to creating a connection between two candidates.
The STUN server
The first of these, STUN, is little more than an echo server. When machines wish to advertise themselves for connectivity, they are required to notify the connectee of their public IP address. After all, a typical user's computer doesn't normally have its own public domain name.
The problem here, however, is that a machine's local network address is very different from its public network address. This is partially what a NAT is for, to translate the IP address of incoming and outgoing packets to and from the local and public IP addresses.
To get around this issue, the user's machine makes a request to a STUN server. As the request packet passes through the local NAT, the local IP address in the packet header is translated to the public IP address.
The STUN server then receives this packet, copies the public IP address in the packet header to its body, then sends it back to the sender. The packet is then passed through the user's NAT, whereby the header IP is translated back into the local IP address.
Since the body remains untouched, the machine is now able to identify its public IP, which it can send to peers wishing to establish contact.

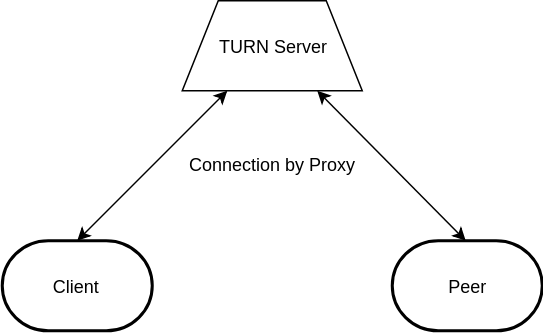
The TURN server
TURN servers are built as an extension to the STUN protocol. The same packet header structure is used, but additional features are provided, known as commands.
TURN servers are used as proxy servers. Clients establish a secure connection to a Peer using what is known as an allocation. This allocation is simply an agreed UDP port on the server that the Peer can connect to, to listen for traffic from the Client. Once the connection between Client and Peer is established on the server, data can pass freely both ways.
The TURN server is designed in such a way that the Client has more power and opportunity to send data than does the Peer. For this reason, it might often be more successful for a Client/Peer connection to work one way than the other, depending on the local network configuration.
Debugging
So, you've stayed with me thus far. This article is supposed to be about debugging WebRTC connectivity, but as you may have realized, there is an awful lot involved to get even to the point of having something go wrong. However, unless you're exceptionally lucky, go wrong it will.
There are numerous potential problems when working with a WebRTC connection. The first of these is not being able to connect at all. In such circumstances, simply following the connection process locally is a good start in establishing the likely cause.
Debugging your local session setup
As I mentioned earlier, WebRTC is primarily a client-side beast. The act of establishing an ICE connection happens almost entirely in the browser itself. The STUN and TURN servers are incredibly simple things by comparison, and thus most issues will be your fault (it's sad but true).
Do not despair; such circumstances actually provide you with a great deal of power in weeding out those troublesome bugs.
When figuring out the root cause of a connection failure, first check the data that passes through your signaling server. Remember, both media and network session description packets are sent through here, so there is a lot of data at your fingertips that you can use to get things working.
The most obvious starting point here, is identifying which packets have been sent and received. Remember that an offer and an answer need to be sent from one machine to the other for a connection to happen.
- Did the Peer receive an offer? Did the Client receive the answer? If either did NOT happen, then no connection can happen.
- Similarly, did ICE candidate packets get generated? Were they shared? Did each party add the other party's packets in the
addIceCandidatemethod? - If all packets were sent and received, did the remote stream get added to the HTML video element via the
RTCPeerConnection'sonaddstreamhandler? Okay, I didn't mention that previously, but I'm sure you looked it up when building your app.
If all is good at this point, it's time to look more deeply at the session data.
Session description protocol
All data used to establish a connection is in SDP format. This can be a little bewildering when you first look at it, but with a little help it can be an enormously enlightening resource.
Now, Wikipedia has quite a good write-up on SDP, but I find this to be a very good introduction to SDP content: https://webrtchacks.com/sdp-anatomy/.
One of the more important aspects of ICE candidate SDP packets is the typ parameter. For WebRTC, this can be one of three options:
- typ host
- typ srflx
- typ relay
typ host
The host type denotes connections to devices on your local network. Typically, all host connections will be made without the use of either STUN nor TURN. The reason for this is that as the connecting device is on the same network, there is no need for local-to-public IP address translation, and thus a connection can be made directly.
If you wish to connect to a machine on the same network, host SDP packets are shared by both machines. If a connection still does not occur, you can probably safely assume that a big mess-up has occurred in your code somewhere!
Note that just because two machines are on the same network, it does not automatically assume a direct connection can be made. The host SDP ICE candidate must be made available by both parties. I have witnessed many times a machine require a TURN connection to connect to itself!
typ srflx
srflx is an abbreviation for Server Reflexive, which is the term used to denote the acquisition of the public IP address. Thus, srflx means Peer-to-Peer connections requiring just STUN. When both parties provide a srflx packet, it means both parties should be connectable via a STUN-only setup but does not mean both parties can connect to each other with such.
It is likely that they can, however.
typ relay
relay is used to denote TURN connectivity. When both parties provide such a packet, a connection should most definitely be possible.
The packet types listed above are not successive; that is to say, a device may provide a srflx packet but not a relay packet or vice versa. When both parties fail to present matching packet types, a connection may not be possible at all.
Testing device connectivity
It is possible to provide an overview of a device's network and media capabilities in a clear and readable form. Google provides a tool you can use at https://test.webrtc.org/.
Simply hit the Start button to get a full description of your machine. Xirsys provides this same tool in their dashboard, but configured to use their STUN and TURN servers instead of Google's.
WebRTC Internals
So, you've gone through everything above and still you can't figure out why a connection is not forthcoming? Thankfully, Chrome provides additional tools to help debug your connectivity, as well as some pretty snazzy graphs for when your connection does work. This is made possible with the Chrome browser's WebRTC Internals functionality.
To use WebRTC Internals, simply open up a new tab and enter the following protocol and URL:
LANG:code
chrome://webrtc-internals
If you already have a WebRTC app running, you should immediately be presented with a bunch of data. Otherwise, start your WebRTC app running in an adjacent tab.
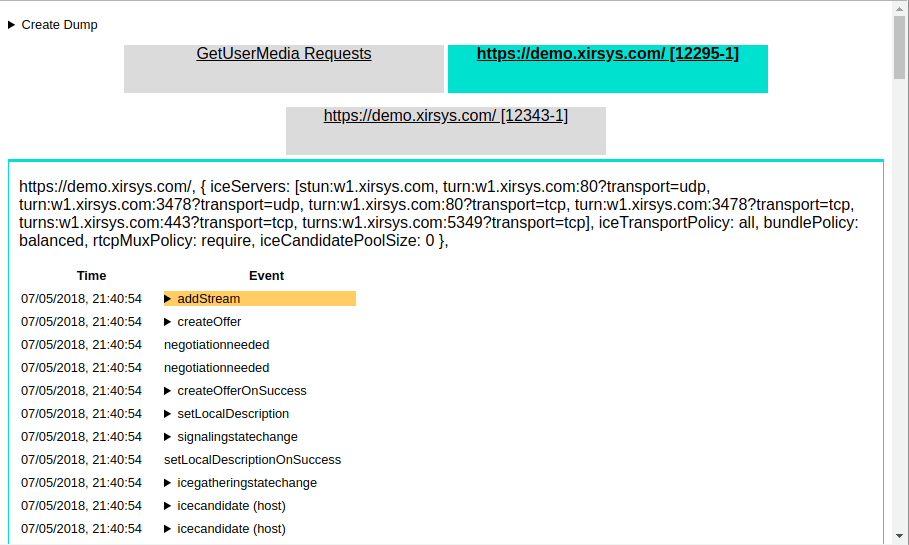
The Internals app provides a breakdown of the API calls to the RTCPeerConnection instances, as well as information from any getUserMedia instances. The latter doesn't provide a lot of information, but the former is an invaluable tool for debugging your app.
ICE configuration
At the top of the Internals page, you'll see the ICE string used to create the connection. If you somehow failed to correctly supply the ICE data in the configuration of your app, this will be immediately noticeable from this data.
Certainly, a lack of ICE data or at the least, ICE data without TURN server provision will potentially cause issues. If this is the case, be sure to trace through your setup and ensure the ICE string is provided BEFORE you start the offer/answer process.
The RTCPeerConnection events
The next group of data will consist of the events and function calls of the RTCPeerConnection instance in order of request. A failure in any of these requests will be highlighted in red.
If you see a red highlighted addIceCandidateFailed event, don't be too alarmed. Such errors can happen and still result in a successful connection.
Note that you will be looking for clues as to why a connection is failing. As each event occurs in order, you can begin to build a picture of the communication steps leading to the failure and therefore find the faulty culprit in your code or environment.
If your connection was successful, there should exist an iceconnectionstatechange event at the end of the list with the value complete. This suggests that all went well and is the result you are hoping to achieve.
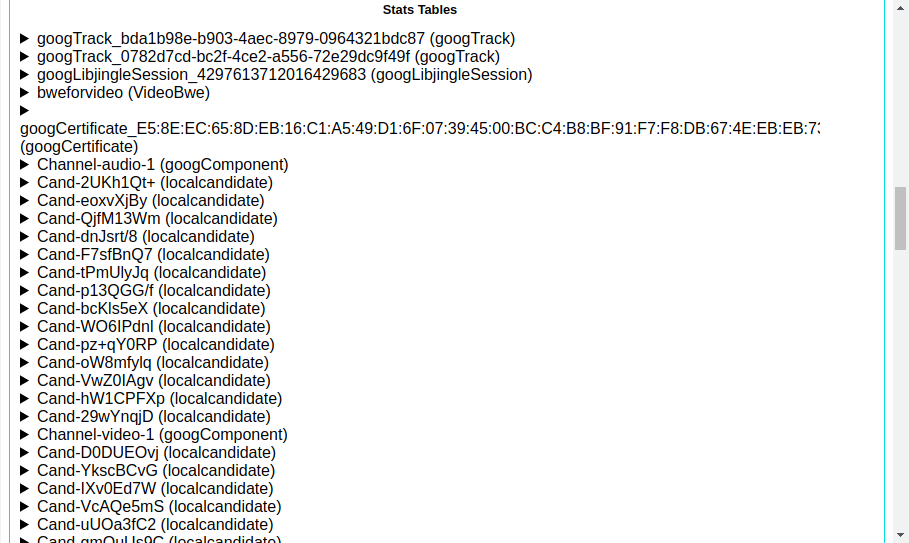
The stats list
The next group of data is related to the statistics of your connection. This will be useful when your connection succeeds and provide an insight into the latency and data transfer within the connection.
The two most useful stats are the ssrc and bweforvideo stats.
ssrc, which stands for Stream Source, is provided for each of your audio and video media tracks. It details the throughput of the associated track and includes useful details such as the RTCP round-trip time.
The bweforvideo stat is the BandWidth Estimate report for the Peer connection.
The getStats function
Very often, it is not possible to access the WebRTC Internals page, such as when the error is encountered by a user of your application.
At such times, the same event data provided by WebRTC Internals can be acquired through the getStats function of the RTCPeerConnection object and by logging the object's various handlers. The getStats function accepts a callback handler and provides it with a detailed object, listing each of the stats values present in the WebRTC Internals interface.
LANG:code
rtcPeerConnection.getStats(function(stats) {
    document.getElementById("lostpackets").innerText = stats.packetsLost;
});
The RTCPeerConnection's oniceconnectionstatechange handler in particular is a very useful tool. This handler will receive the condition of the connection as it changes and may be one of any of the following:
new- The WebRTC engine is waiting to receive remote candidates via calls toRTCPeerConnection.addIceCandidate().checking- The WebRTC engine has received remote candidates and is comparing both local and remote candidates to attempt to find a suitable match.connected- A suitably matching pair of candidates has been identified and the connection established. Candidates may still continue to be shared as per the Trickle ICE protocol.completed- The WebRTC engine has finished gathering candidates, has checked all pairs against one another and has found a connection for all components.failed- The WebRTC engine has exhausted all candidates' pairs and failed to find a suitable match.disconnected- At least one track in theRTCPeerConnectionhas disconnected. This may trigger intermittently and resolve on its own on unreliable networks. At such times, the state may change back toconnected.closed- TheRTCPeerConnectioninstance has closed and is no longer handling requests.
Typically, if the state changes to failed, then it is possible to cycle through each of the passed ICE candidate packets, now available on both parties' machines, to discern why the failure took place; for example, if one party provided only host and srflx packets, while the other party provided host and relay packets, but both parties were on different networks.
Experiencing a Blank Video Window
Often, users may experience an issue whereby a connection will result in working audio but the video window for one or both users shows as completely black.
Now, logic will dictate that this is a local problem. Since the connection itself is agnostic of the data transferred between it, and since audio is clearly flowing from one device to the other, the issue must therefore be associated with the stream assigned to the video component.
In such circumstances, the cause is often the result of assigning the video stream to the video tag before the connection state is ready. Ensure that the stream is assigned only when the RTCPeerConnection instance's state is notified as completed.
External Issue Resolution
Besides the RTCPeerConnection API and WebRTC Internals, another useful tool to decipher connectivity issues is through the use of a network packet sniffer, such as Wireshark.
Running a Wireshark capture while attempting a WebRTC connection will log STUN protocol packets in the main Wireshark window. You can filter for these packets by entering stun in the filter field, followed by the Enter key.
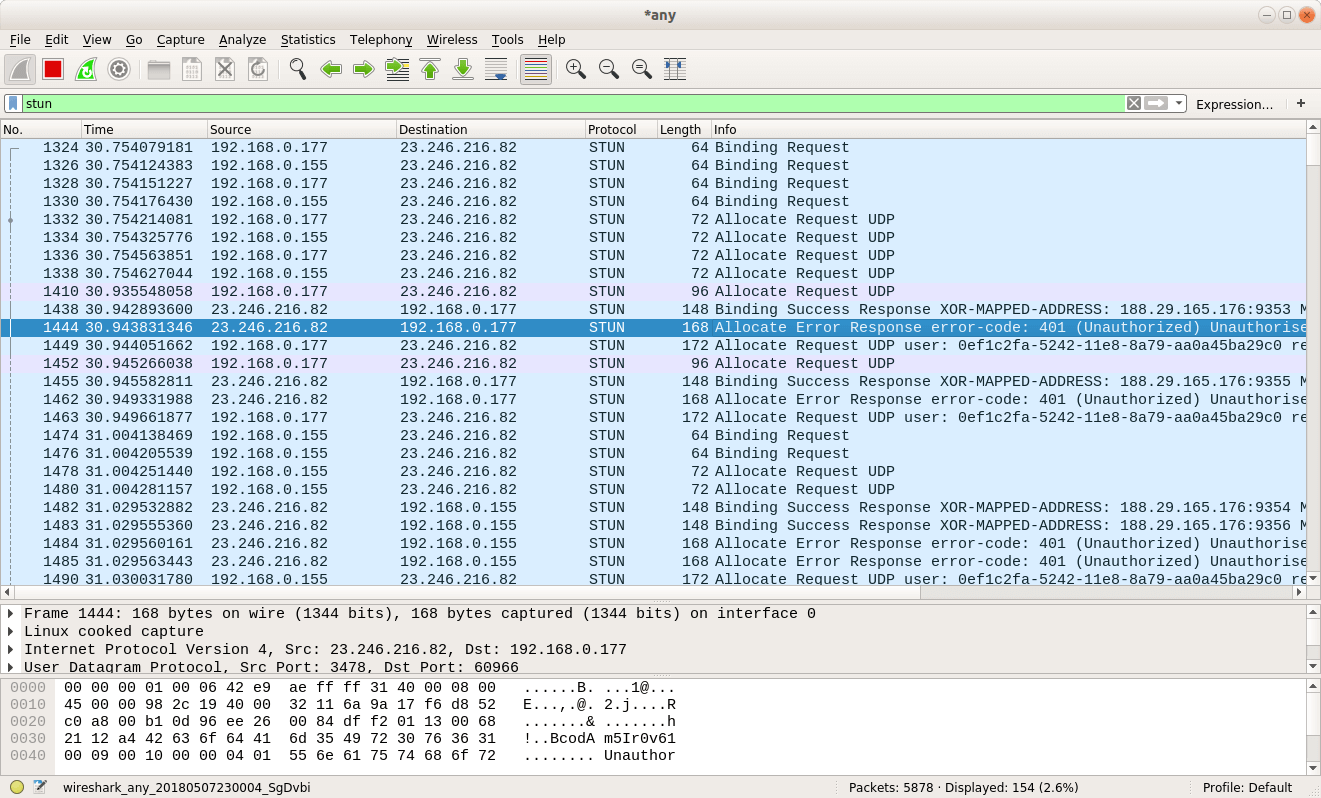
When logging connection data, you are typically looking to first identify the connection type. If only Binding requests and responses are logged, then only srflx or STUN connection requests are being made. A TURN connection, on the other hand, will log both STUN Binding requests and TURN specific requests, such as Allocation and CreatePermission packets.
For TURN connections, check to see that successful Allocation responses are provided. If all Allocation responses show as failures, it could be that the credentials supplied in the ICE string are invalid or out of date. Try updating the credentials and trying again.
If you see CreatePermission Success Response packets in the Wireshark capture, then it's usually safe to assume all is well. Seeing ChannelBind packets is an even better result, suggesting that high-speed TURN connectivity has been established.
Cellular Connection Issues
It's a sad fact that creating WebRTC connections on mobile devices can be a bit hit and miss. Numerous support requests have come my way complaining about apps that work fine on WiFi, but fail completely on 3G or 4G.
Debugging such applications can be a pain, since you can't use an application like Wireshark on a mobile device and mobile Safari doesn't provide a nice interface like WebRTC Internals.
At such times, it pays to stop and think laterally about the problem. If the app works fine on WiFi, it's unlikely to be an app problem but an issue with the mobile service provider. Since debugging WebRTC applications is not much fun on a mobile device, you should instead consider investing in a mobile internet dongle, such as this one.
The point here is to attempt to emulate the mobile environment using your desktop technologies in order to leverage the debugging tools at your disposal. With the above device, you can even force 3G in a 4G reception area so as to see the different connection results that might occur.
Conclusion
While WebRTC is difficult to work with, there are a large number of possible avenues for finding annoying faults in your applications, many blogs with useful tricks and techniques, and companies offering free support, such as Xirsys.
As an aside, I really would encourage you to read the RFC specifications for STUN and TURN, as well as the specification for WebRTC itself. These documents can be a little tough to get through, but there is a lot you can learn from understanding even a fraction of their content which would help make your life more simple.