

Simply put, Pipeline as Code means treating your build and deploy jobs like application code. How you deliver and deploy your applications is just as important as how you create them, so managing those activities with the same policies and procedures you use for your code makes a lot of sense.
In this post, you’re going to learn what Pipeline as Code entails. We’ll discuss how to implement it and why you should. We’ll also go over a few examples.
What Is Pipeline as Code? The Short Version
Pipeline as Code means configuring your builds, deployments, and tests with source code that you store in a source repository. It lets you manage changes to these activities the same way you manage your application code. For example, you use pull requests to make changes, so at least one other engineer approves and tracks them. You correlate changes with requirements that you enter into systems like Jira. You tie unit testing with builds and deploy via pipeline code.
Pipeline as Code Examples
Let’s go through a simple example of Pipeline as Code and how it differs from simple build automation.
Docker Container Build Scripts
First, consider a Jenkins job for building a container image. The Dockerfile and required components are in a directory held in a Git repository that stores the code for several container images. The developer uses a simple shell script to build and push the container image from their laptop to a container registry:
LANG:bash
#!/bin/bash

docker build --no-cache --network=host -t nexus.mycompany.com:18081/my_first_container .

docker push nexus.mycompany.com:18081/my_first_container
You could reuse the shell script and configure a Jenkins job like this.
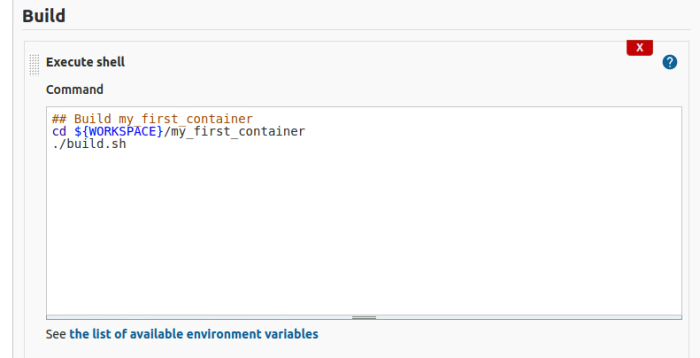
The build script is in version control. Therefore, any changes made to the script take effect with each commit and push.
But what happens when the build gets more complicated? For example, we already said that this repository has more than one container image definition. Do you need to create a job for each container image? Or could you create a parameterized build similar to this?
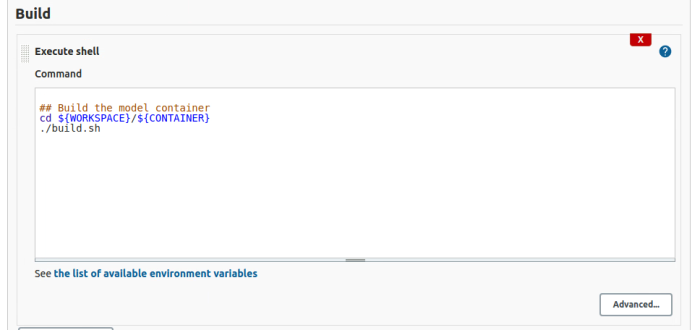
In this example, ${CONTAINER} is set by a build choice parameter.
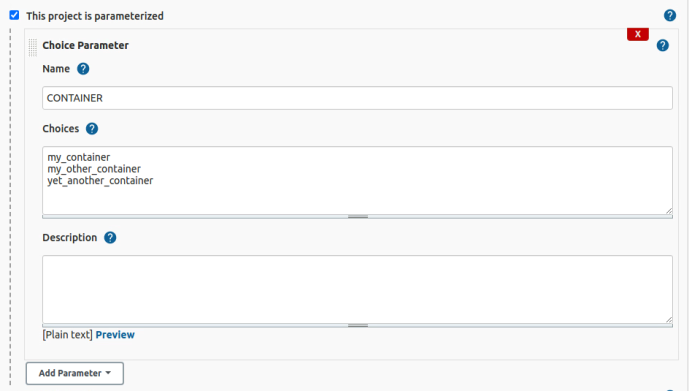
This job’s configuration is simple enough to understand at a glance. The ${CONTAINER} parameter sets both the working directory and the tab for the container image. If you add a new container image, make sure the tag and the directory names match, so the user knows which to select, and all you need to do is add that option to the Choice Parameter.
But, the system relies on a couple of conventions.
- The build scripts are consistently named build.sh.
- Container image directories are always at the top of the repository.
- Directory and container image names are the same.
All three of these conventions are perfectly defensible and simple to work with. But they cross a boundary between Jenkins and Git. That is, if the build directories are pushed down a level into the repository, one of the script names changes, and Jenkins will fall out of sync and start to fail. Moreover, if the container image name and directories don’t match, users have to worry about which option to use.
There’s also a more subtle problem. These builds only have one step: run a script. The container image builds and deploys are lumped together. Consequently, if one of them fails, you’ll find yourself reading logs to figure out which.
Container Image Build Pipelines
With Pipeline as Code, the container image build steps are contained in a Jenkinsfile in the code repository. So, you could replace the second job above with this Jenkinsfile.
LANG:code
pipeline {
    agent any
    parameters {
        choice(name: 'CONTAINER', choices: ['my_container', 'my_other_container', 'yet_another_container'], description: '')
    }
    stages {
        stage('Build') {
            steps {
                script {
                    dir(“${CONTAINER}”) {
                        sh "docker build --no-cache --network=host -t nexus.veliosystems.com:18081/${CONTAINER} ."
                    }
                }
            }
        }
        stage('Deploy') {
            steps {
                script {
                    dir(“${CONTAINER}”) {
                        sh "docker push  nexus.veliosystems.com:18081/${CONTAINER}”
                    }
                }
            }
        }

    }
}
Then you would configure your build job this way.
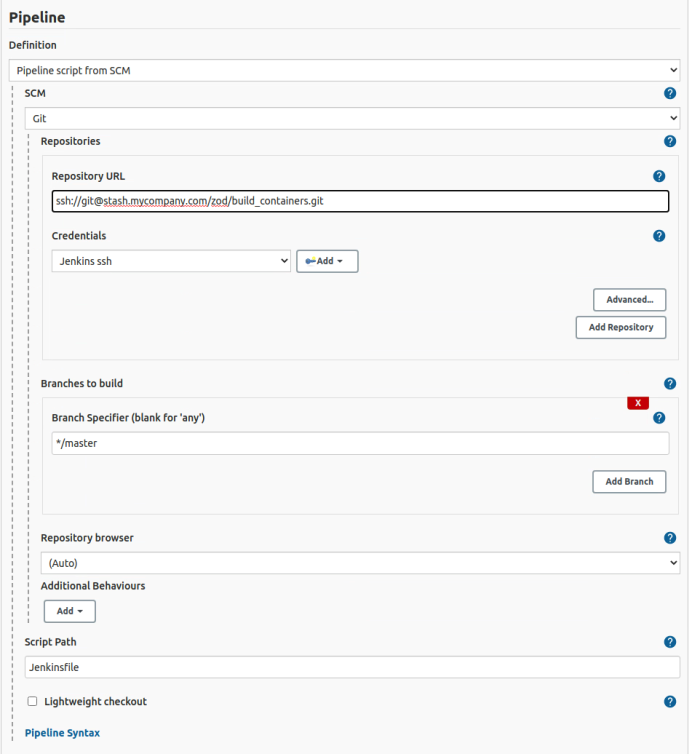
This tells Jenkins to look in the top-level directory of your repository for a file named Jenkinsfile. Now, if you want to make a change to your build and deploy process, you make it in the source repository. Then you can track changes to your build and deploy jobs. You can also run them through pull requests. Your build and deploy process is code.
Your Jenkins build parameters stay the same as before. The $CONTAINER variable is passed to the Jenkinsfile the same way it was to the shell build step.
Now you’re building all of the container images in that repository on your Jenkins server with the same code instead of relying on a set of shell scripts that are essentially copy-and-paste copies of each other.
We recommend that you keep your Jenkinsfiles as simple as possible, and keeping complicated logic in shell scripts means that you can run the exact same things in Jenkins and in your local dev environment. In a real-world scenario, though, it may be best to keep a generic shell script to which the Jenkinsfile can then call out.
The build steps are, broadly speaking, exactly as they were in the shell scripts. The point of Pipeline as Code is not to change your build. It’s to manage it like code.
But this Jenkinsfile does define two stages: “Build” and “Deploy.” Jenkins will display these stages separately in the Stage View.
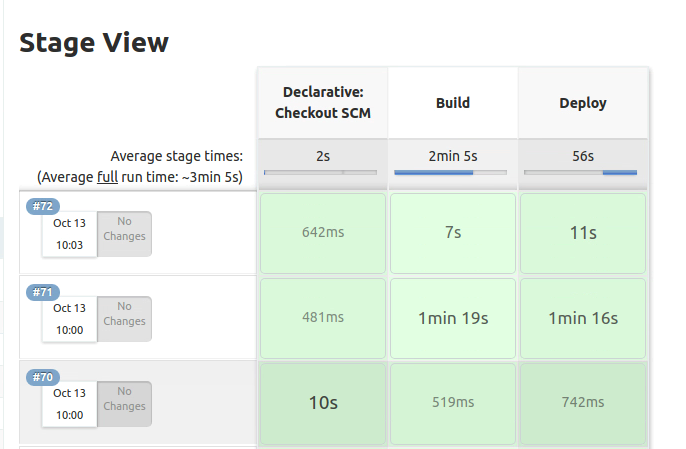
So, if a build fails, you’ll have an immediate idea of where and how.
You could move the actual build and deploy stages to a shared library to ensure that all of your container images are built and deployed the same way.
Building and Deploying With Pipeline as Code
Using the example of a container image is almost a contrived use case for taking advantage of Pipeline as Code. Since all of the complexity in building a container resides in the Dockerfile, the deployment consists of simply pushing the container image to a registry, and there are no tests.

Building and deploying an application presents a range of more complex problems. Let’s consider a more complex scenario.
- Check out code from one or more repositories.
- Build a set of libraries.
- Build an application against those libraries.
- Test the application.
- Upload the application to a repository.
- Download the code to one or more servers from the repository.
- Start or restart the application on those servers.
If you picture how the code moves through these seven steps, then you can see why pipeline makes a good metaphor. The code starts at the checkout and flows through each step until its run at the final stage.
Managing these stages in a text box would be unwieldy and error-prone. Who changed the process last? Why? Was it working before the last change?
Pipeline as Code answers those questions. This build is contained in a Jenkinsfile managed in source control, right next to the application code. Changes are tracked, like the application, and can be tested on branches before you merge to a production or release branch.
Pipeline as Code
Pipeline as Code is one part of the greater “everything as code” movement. Its roots can be traced back to “infrastructure as code” as an integral aspect of DevOps.
Today, however, the “as code” movement has evolved to become an industry best practice. It represents the efforts to automate processes that are too difficult to manage manually. Once they are automated, manage the automations using the same tools and techniques developers use for code. Store the configurations in source control, review and test them on branches, and merge them into production.
This post covered what Pipeline as Code is and why you want to start using it today. Then we covered a couple of practical examples to demonstrate how it helps manage simple and complex build pipelines.
In conclusion, Pipeline as Code will help you manage your build and deployment processes more effectively with better change management and more robust testing.
This post was written by Eric Goebelbecker. Eric has worked in the financial markets in New York City for 25 years, developing infrastructure for market data and financial information exchange (FIX) protocol networks. He loves to talk about what makes teams effective (or not so effective!).