

In recent months, CloudBees Continuous Delivery / Release Orchestration (CD/RO) has announced two notable features: support for Argo Rollouts and Third-Party Deployment. While our customers have asked several questions regarding both, the most frequent is, does this also mean you can support Argo CD?
The answer is a definitive yes! In this blog, we outline what Argo CD is, the benefits of using Argo CD, and how CloudBees CD/RO can enhance Argo CD to provide a complete release process.
What is Argo CD
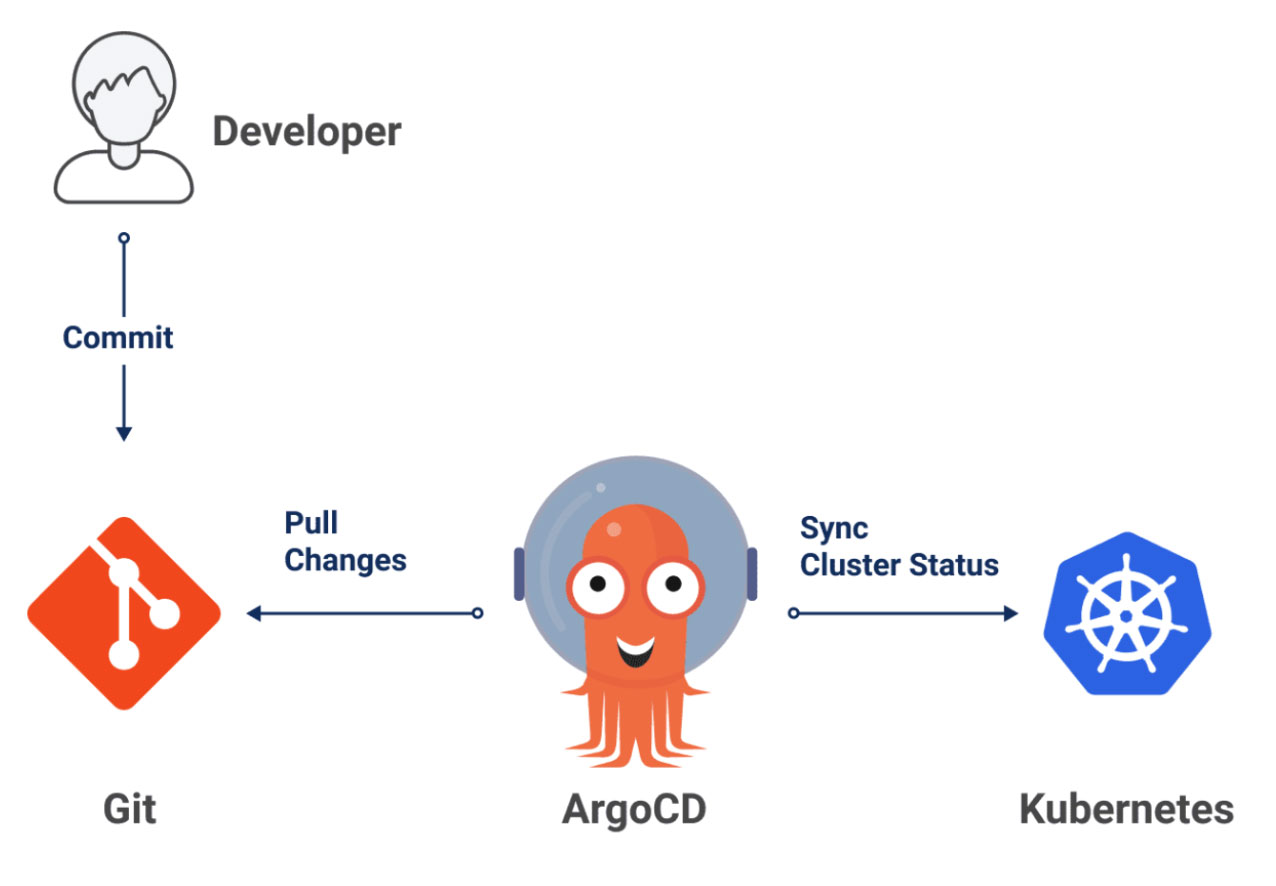
Argo CD is a declarative GitOps continuous delivery tool for Kubernetes. It automates the deployment and updates of applications in Kubernetes clusters, ensuring consistency while reducing manual errors. It is one of four sub-projects for the Argo Project, which graduated from the Cloud Native Computing Foundation (CNCF) in December 2022, meaning it is safe to use at scale.
Argo CD Benefits
Argo CD is a great deployment solution for teams focusing exclusively on Kubernetes applications. It is popular with its users, as evidenced in a 2023 user survey, with praise for its resource UI, WebUI, and GitOps self-service capabilities. Additional benefits include:
- Automated deployments: automatically ensure that the live state of your application matches the desired state defined in Git, speeding up the deployment process and reducing the risk of manual errors.
- Environment consistency: application states are defined declaratively in Git repositories, ensuring all environments are aligned.
- Visualization: real-time visual feedback on the status of applications.
Argo CD is an optimal choice for platform engineering teams needing to maintain Jenkins and other Kubernetes tools for a few reasons. It allows infrastructure as code repos, the ability to define versions, and when there’s an upgrade, you can make a pull request to change it. In this example, a full-release pipeline is unnecessary with internal tools.
Argo CD Limitations
Argo CD is specifically designed for deployments, which is only one step in the release process. Thus, when dealing with organizations looking beyond deployments with a mixture of application types (beyond Kubernetes), Argo CD must be combined with other automation solutions to drive maximum value.
This is often the case with large, highly regulated enterprises that value consistency, often requiring a more holistic release process covering quality gates, environment inventory, and holistic analytics.
These limitations become apparent when dealing with software delivery teams releasing applications to end customers (as opposed to internal tools). These teams require more structure from an auditing perspective to prove if the proper checks pass. In this case, an entire release pipeline is necessary.
Enhancing Argo CD with CloudBees
CloudBees CD/RO is an enterprise-grade deployment automation and release orchestration solution spanning the entire release process (not just deployments). This breadth helps organizations expand beyond Argo CD capabilities, as evidenced in the following chart:
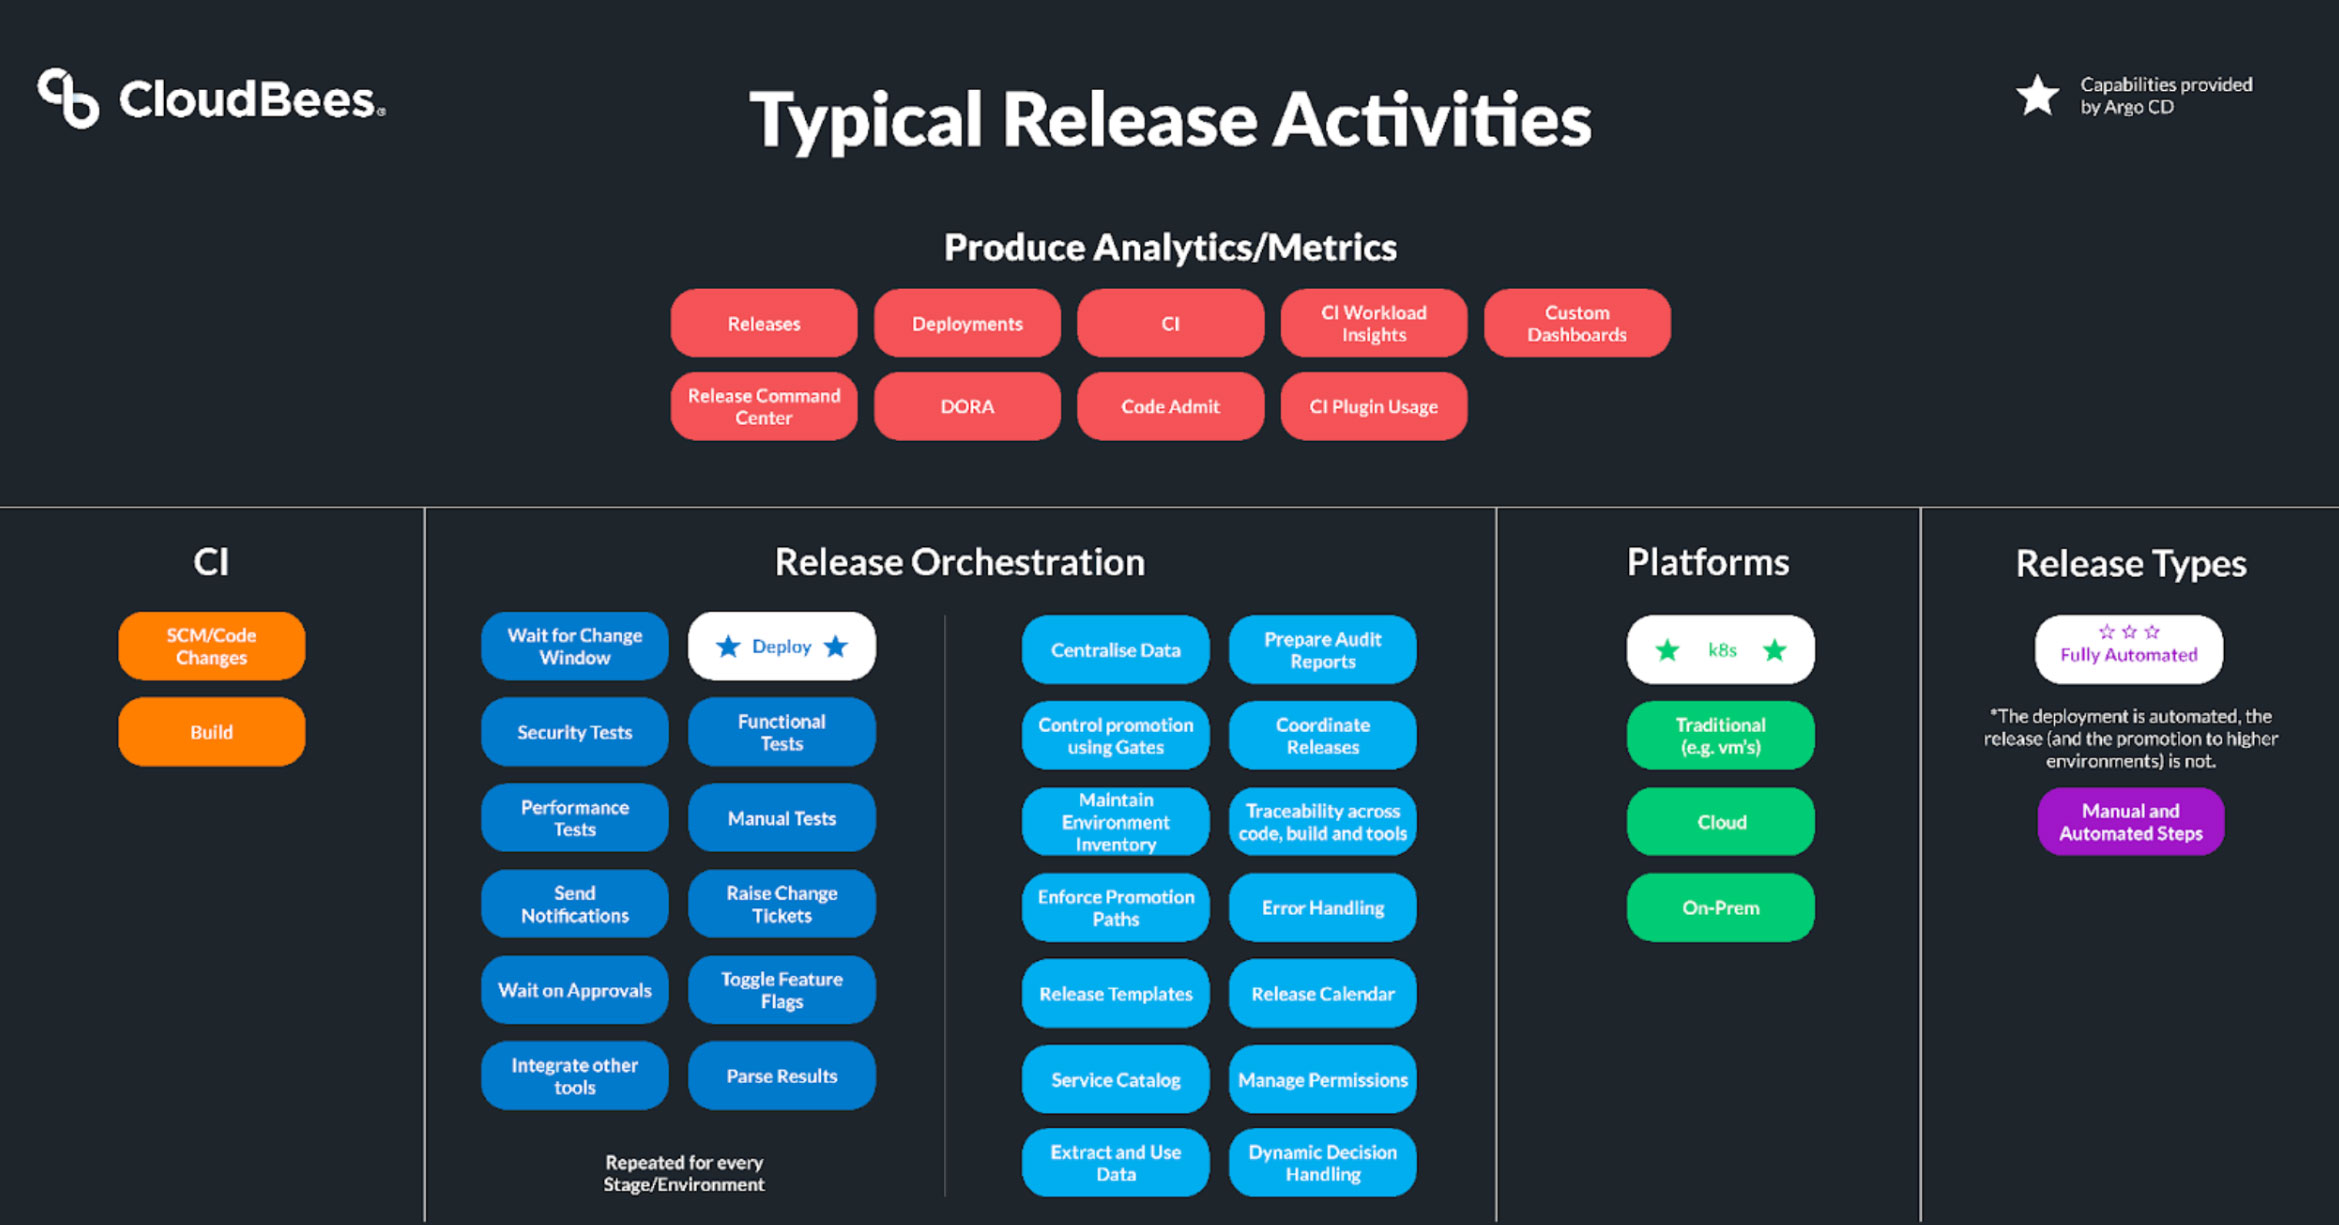
Using these two solutions in tandem allows developers to “commit and forget,” which optimizes their experience. In this example, Argo CD kicks off the deployment, and CloudBees CD/RO handles the remainder of the release process. As a result, developers don’t have to go back to Argo CD each time the deployment needs to advance stages.
CloudBees CD/RO enhances Argo CD by monitoring post-deployment events to confirm the deployment's success. We provide this insight through integrations with monitoring solutions.
When using CloudBees CD/RO, the best way to enhance Argo CD is by using our Third-Party Deployment feature.
Third-Party Deployment
CloudBees third-party deployment allows teams to perform deployments using their existing deployment tools (Argo CD, Flux CD, etc.) and still enjoy the benefits of CloudBees CD/RO application modeling–including automated repeatability, process visibility, environment inventory, and analytics. These enhancements help to balance speed with governance and address use cases for enterprises seeking:
- Manage their deployments within Argo CD but aim to surface the workflows in CloudBees CD/RO for enterprise-grade governance and insights into their release process.
- A consistent and comprehensive release process spanning a varied application portfolio (traditional and cloud-native).
- An easy tool for creating clusters in code (Argo CD) while ensuring the deployment complies with internal policies (CD/RO).
A combined approach allows deployment teams to continue working in their preferred toolset while getting additional value without logging into a new tool. This approach provides a comprehensive release solution.
Streamlining your software delivery process
CloudBees provides built-in deployment and works well with third-party providers. For enterprises evaluating their deployment strategy, CloudBees CD/RO natively handles Kubernetes-based deployments using its microservices modeling approach.
By allowing CloudBees CD/RO to handle your Kubernetes-based deployments alongside mapping and orchestrating the remainder of your software delivery process, you benefit from a consistent way of configuring and managing your entire release process from a single solution.
Summary
All enterprises are at different stages of DevOps maturity. Argo CD continues to gain popularity through its UI and ability to provide a GitOps approach for organizations looking to deploy applications in Kubernetes. However, there are limitations to using Argo CD in isolation, which requires teams to select the right tool for the job.
When maintaining internal tools in Kubernetes, Argo CD is an excellent solution as it does not require a full-release pipeline. When extending to software delivery teams for customer-facing applications, which require audit trails and ensuring agreed-upon processes are followed, you need to enhance Argo CD. This is where CloudBees CD/RO comes in based on the organization's use case:
- For enterprises using Argo CD as their preferred deployment solution, CloudBees CD/RO offers enhancements through automated repeatability, environment inventory, and analytics. Organizations can take advantage of these benefits using our third-party deployment feature.
- For enterprises seeking to streamline their deployment process, CloudBees CD/RO’s microservices application modeling feature allows customers an alternative to Argo CD with the bonus of complete visibility, insight, and governance into Kubernetes-based deployments from a single solution.
To conclude, we offer organizations flexibility in the deployment process. It’s all about selecting the right tool for the job. By correctly identifying the use case upfront, CloudBees can provide solutions to maximize your release process.