A hot topic amongst continuous delivery pipelines is parallelism: doing a lot of work, perhaps as much as you can with the resources you have, at the same time. In some cases that is triggering jobs and allowing them to run concurrently, other times it is running parts of your pipeline in parallel with the aim of getting feedback sooner and making the most of your resources.
Many people might not realize but Jenkins is quite good at parallel workloads, either across nodes in distributed builds, or even inside a running build. In this case I wanted to talk through some of the best ways to make this work for you with the Pipeline plugin, using Pipeline script. Jenkins can even automatically split your test suite up into roughly equal running streams! Read on.
Optimizing your pipeline with parallelism
Reasons you may want to use parallelism to get faster results:
- You have an abundance of elastic build workers you can distribute parts of your work over
- You have really powerful build machines with lots of CPUs you can utilize
- Your pipeline has a lot of IO "waiting"
- Your pipeline has integration tests that depend on (slow) external services
When you visualize your pipeline, parts may leap out that you realize you can do in parallel. This may happen as you plan out your pipeline, or perhaps when you are watching things execute and are bothered by hotspots where things seem to slow down (the slow bits are where you can look to run in parallel).
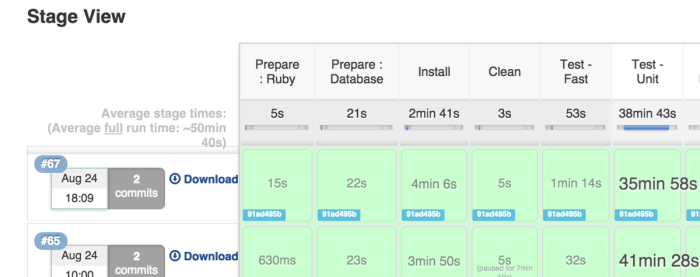
Stage view showing stages through a pipeline.
Parallel all the things
First, let's quickly look at the "parallel" construct in Pipeline script. It goes like this:
LANG:code
   parallel (
     "stream 1" : { ... things ...  },
     "stream 2" : { ... things in parallel ... }
   )
That's about all there is to it. When this is used, the stuff inside {} blocks will run concurrently - i.e. stream 1 and 2 will run at the same time. What you do in those block is - well, whatever you want. It can run in place as a thread, or you can grab another node and run it distributed.
Lets dive a little deeper into the 2 main ways this can work:
1. Making good use of one build server
In some cases you have a build that could run different parts of a test suite in parallel, or you just want to make use of a powerful build machine, in that case:
LANG:bash
node {
   git "git@github.com..."
   parallel (
     phase1: { sh "echo p1; sleep 20s; echo phase1" },
     phase2: { sh "echo p2; sleep 40s; echo phase2" }
   )
  sh "run this after both phases complete"
}
The phases run at the same time (after first cloning the source repository). One takes 40 seconds, one takes 20, but when the shorter one finishes, it waits until the longer one is finished before running the final step. This all happens on one "node", one server. This effectively uses multi threading to make more use of that server. Great if you can run different parts of your test suite together, or run some IO tests at the same time as other tests.
2. Distributed parallel with many build servers
First, let's note that Pipeline has the concept of a "node" which is Jenkins' way of selecting where a build can run. A node is often a remote machine, but could be the local controller. The node syntax is dead simple:
LANG:code
node { ... do some work }
You can also optionally label the node you want to select to run on (e.g., you may want a certain Linux or Windows flavor).
To do work distributed across nodes:
LANG:code
parallel (
    "stream 1" : {
                     node {
                           unstash "binary"
                           sh "sleep 20s"
                           sh "echo hstream1"
                       }
                   },
    "stream 2" : {
                     node {
                           unstash "binary"
                           sh "echo hello2"
                           sh "hashtag fail"
                       }
                   }
          )
This is very similar to above, but in this case the "node" blocks are inside the parallel streams. This means Jenkins Pipeline will run off and find 2 build workers to distribute the work on, and do it at the same time, collecting the results. This also has the "unstash" construct:
Stash and unstash - distribute artifacts
In a case where you are running builds across nodes, you may not want to clone the source in each location again and build it. In this case you can "stash" and "unstash" pre-made artifacts from earlier steps, to save time. Stashing doesn't keep these around permanently ("archive" does that). To stash something from a previous stage, use:
LANG:code
  stash includes: 'path/to/things/*', name: 'binary'
Then to get it back on the other nodes:
LANG:code
  unstash 'binary'
The 'binary' string is just an arbitrary name and you can refer to it by anywhere in the pipeline to get it back.
Different parts of builds on different OSes
A common case for multi node parallelism is to run test suites against different OSes, or browsers, or perhaps mobile platforms.
Something like:
LANG:code
parallel (
    "stream 1" : {
                     node ("windows") { ...

    "stream 2" : {
                     node ("linux") ...
This uses labels configured on the controller to select what build worker should be used for that stream of a build.
Automatic splitting of tests to speed up test stages
One very, very powerful feature is called "splitTests", provided by the Parallel Test Executor Plugin (which provides the Pipeline "splitTests" construct).
With splitTests, you choose the concurrency level (i.e. how many things you want to do at the same time) and it will automatically split your test suite into equal running parts that it can run concurrently. It does this by running the suite linearly the first time.
You can read more about this advanced feature here.
Triggering multiple builds
As pipelines get more complex, and test suites run longer (it happens, despite best efforts) it is likely that triggers of the build (source code commits, other upstream apps or workflows) become so frequent that you end up having concurrent pipelines running at any one time. Jenkins has always been pretty good and flexible with this, but with Pipeline you have even more options.
This is best represented with a diagram:
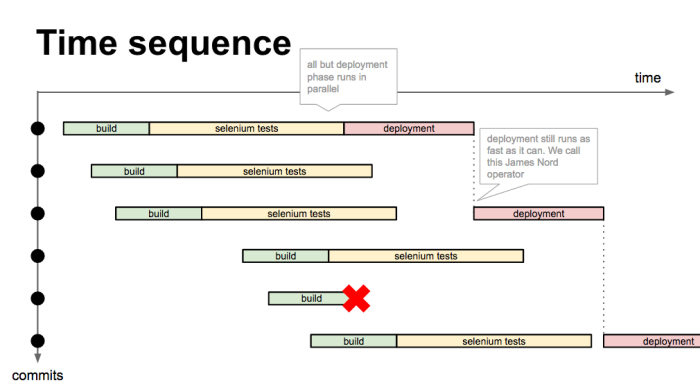
There are a lot of commits triggering builds, many overlapping. The deployment stage is gated by limiting the concurrency to 1, so whilst deployment is happening, other builds can happen, but you only get the latest one deployed when the previous deployment is finished. This is very important as you have rapid changes and continuous delivery. This is colloquially known as the "James Nord" operator (if you ever meet James, ask him why!).
You can limit the concurrency of any stage (by default, concurrency is allowed). A stage may have access to a finite resource, and you want to limit access (so only one at a time, and not waste it on redundant builds). To enable concurrency limits from a stage, the construct looks like this:
LANG:code
stage name: "testing", concurrency: 1

node {
  sh "echo lets test this"
}
You can read more about this here.
Conclusion
Hopefully you can see the power of these ways of making use of parallelism. I have a contrived combination of these concepts in one script here.
Michael NealeArchitectCloudBeesTweet at me @michaelneale
Learn more about managing and scaling Jenkins for the enterprise with this eBook.