
If you're running a Swarm Mode cluster or even a single Docker engine, you'll end up asking this question:
How do I keep track of all that's happening?
The answer is "not easily."
You need a few things to have a complete overview of stuff like:
- Number and status of containers
- If, where, and when a container has been moved to another node
- Number of containers on a given node
- Traffic peaks at a given time
- Orphan volumes and networks
- Free disk space, free inodes
- Number of containers against number of veths attached to the
docker0anddocker_gwbridgebridges - Up and down Swarm nodes
- Centralize logs
The goal of this post is to demonstrate the use of Elasticsearch + Kibana + cAdvisor as tools to analyze and gather metrics and visualize dashboards for Docker containers.
Later on in this post, you can find a dashboard trying to address a few points from the previous list. There are also points that can't be addressed by simply using cAdvisor, like the status of Swarm Mode nodes.
Also, if you have specific needs that are not covered by cAdvisor or another tool, I encourage you to write your own data collector and data shipper (e.g., Beats). Note that I won't be showing you how to centralize Docker containers log on Elasticsearch.
Why Do We Need to Monitor Containers?
Imagine yourself in the classic situation of managing a virtual machine, either just one or several. You are a tmux hero, so you have your sessions preconfigured to do basically everything, monitoring included. There's a problem in production? You just do a top, htop, iotop, jnettop, whatevertop on all your machines, and you're ready for troubleshooting!
Now imagine that you have the same three nodes but split into 50 containers. You need some history displayed nicely in a single place where you can perform queries to know what happened instead of just risking your life in front of those ncurses tools.
What Is the Elastic Stack?
The Elastic Stack is a set of tools composed of:
- Elasticsearch
- Kibana
- Logstash
- Beats
We're going to use a few open-source tools from the Elastic Stack, such as Elasticsearch for the JSON-based analytics engine and Kibana to visualize data and create dashboards.
Another important piece of the Elastic Stack is Beats, but in this post, we're focused on containers. There's no official Beat for Docker, so we'll just use cAdvisor that can natively talk with Elasticsearch.
cAdvisor is a tool that collects, aggregates, and exports metrics about running containers. In our case, those metrics are being exported to an Elasticsearch storage.
Two cool facts about cAdvisor are:
- It's not limited to Docker containers.
- It has its own webserver with a simple dashboard to visualize gathered metrics for the current node.
Set Up a Test Cluster or BYOI
As I did in my previous posts, my habit is to provide a small script to allow the reader to set up a test environment on which to try out my project's steps in no time. So you can use the following not-for-production-use script to set up a little Swarm Mode cluster with Elasticsearch running as a container.
If you have enough time/experience, you can BYOI (Bring Your Own Infrastructure).
To follow this post, you'll just need:
- One or more nodes running the Docker daemon >= 1.12
- At least a stand-alone Elasticsearch node 2.4.X
Again, note that this post is not about setting up a production-ready Elasticsearch cluster. A single node cluster is not recommended for production. So if you're planning a production installation, please refer to Elastic guidelines.
A friendly note for early adopters
I'm usually an early adopter (and I'm already using the latest alpha version in production, of course). But for this post, I chose not to use the latest Elasticsearch 5.0.0 alpha. Their roadmap is not perfectly clear to me, and I don't want be the root cause of your problems!
So the Elasticsearch reference version for this post is the latest stable version, 2.4.0 at the moment of writing.
Test cluster setup script
As said, I wanted to provide this script for everyone who would like to follow the blog without having to figure out how to create a Swarm cluster and install an Elasticsearch. Of course, you can skip this if you choose to use your own Swarm Mode engines and your own Elasticsearch nodes.
To execute the setup script, you'll need:
- Docker Machine - latest version: to provision Docker engines on DigitalOcean
- DigitalOcean API Token: to allow
docker-machineto start nodes on your behalf

Create Cluster Script
Now that you have everything we need, you can copy the following script in a file named create-cluster.sh:
LANG:bash
#!/usr/bin/env bash
#
# Create a Swarm Mode cluster with a single master and a configurable number of workers
workers=${WORKERS:-"worker1 worker2"}
#######################################
# Creates a machine on Digital Ocean
# Globals:
#   DO_ACCESS_TOKEN The token needed to access DigitalOcean's API
# Arguments:
#   $1 the actual name to give to the machine
#######################################
create_machine() {
  docker-machine create \
    -d digitalocean \
    --digitalocean-access-token=$DO_ACCESS_TOKEN \
    --digitalocean-size 2gb \
    $1
}
#######################################
# Executes a command on the specified machine
# Arguments:
#   $1     The machine on which to run the command
#   $2..$n The command to execute on that machine
#######################################
machine_do() {
  docker-machine ssh $@
}
main() {
  if [ -z "$DO_ACCESS_TOKEN" ]; then
    echo "Please export a DigitalOcean Access token: https://cloud.digitalocean.com/settings/api/tokens/new"
    echo "export DO_ACCESS_TOKEN=<yourtokenhere>"
    exit 1
  fi
  if [ -z "$WORKERS" ]; then
    echo "You haven't provided your workers by setting the \$WORKERS environment variable, using the default ones: $workers"
  fi
  # Create the first and only master
  echo "Creating the master"
  create_machine master1
  master_ip=$(docker-machine ip master1)
  # Initialize the swarm mode on it
  echo "Initializing the swarm mode"
  machine_do master1 docker swarm init --advertise-addr $master_ip
  # Obtain the token to allow workers to join
  worker_tkn=$(machine_do master1 docker swarm join-token -q worker)
  echo "Worker token: ${worker_tkn}"
  # Create and join the workers
  for worker in $workers; do
    echo "Creating worker ${worker}"
    create_machine $worker
    machine_do $worker docker swarm join --token $worker_tkn $master_ip:2377
  done
}
main $@
And make it executable:
LANG:code
chmod +x create-cluster.sh
Create the cluster
As the name suggests, we'll use the script to create the cluster. By default, the script will create a cluster with a single controller and two workers. If you want to configure the number of workers, you can do that by setting the WORKERS environment variable.
Now, let's create that cluster!
LANG:code
./create-cluster.sh
Ok, now you can go out for a coffee. This will take a while.
Finally the cluster is ready!
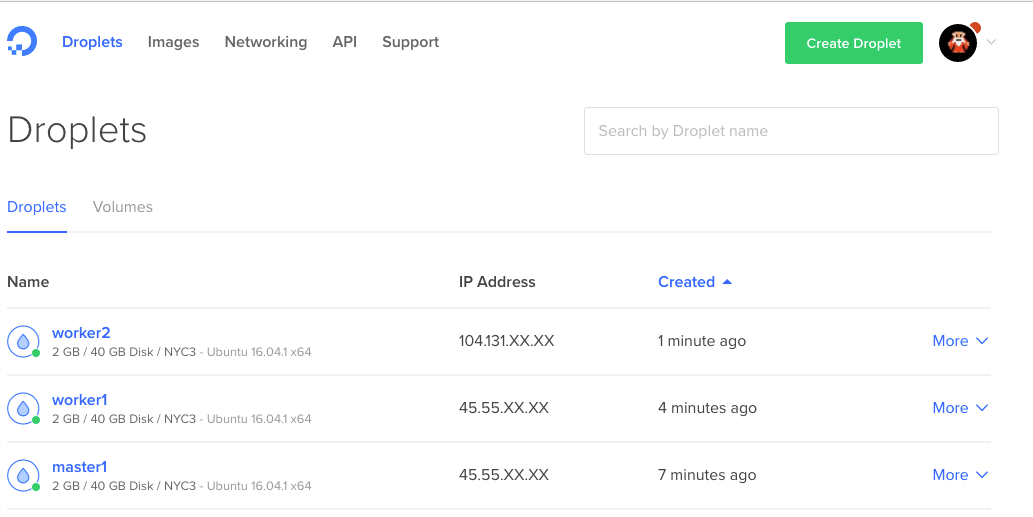
Now, to verify that our Swarm Mode cluster is up and running, we can SSH into the controller:
docker-machine ssh controller1
and we can list the nodes in the cluster:
LANG:bash
docker node ls
LANG:code
ID                           HOSTNAME  STATUS  AVAILABILITY  MANAGER STATUS
26fi3wiqr8lsidkjy69k031w2 *  master1   Ready   Active        Leader
dyluxpq8sztj7kmwlzs51u4id    worker2   Ready   Active
epglndegvixag0jztarn2lte8    worker1   Ready   Active
Install Elasticsearch and Kibana
Note that from now on, all the commands are intended to be executed against a controller node (controller1).
In a production environment, you'll probably want to install Elasticsearch and Kibana on a separate set of instances with proper sizing. In this case, we're just going to install them as containers in the same Swarm Mode cluster.
In order to connect Elasticsearch with Kibana and cAdvisor, we need to create a custom network. Since we're in a cluster and the containers may be in different nodes, our network will use the overlay driver.
You might be asking yourself, "Why do I need a network? Aren't links enough?" Please consider that since the introduction of user defined networks, links are considered a legacy feature.
From the documentation:
Before the Docker networks feature, you could use the Docker link feature to allow containers to discover each other and securely transfer information about one container to another container. With the introduction of the Docker networks feature, you can still create links, but they behave differently between default bridge network and user defined networks.
So let's create an overlay network named monitoring:
LANG:bash
docker network create monitoring -d overlay
Elasticsearch container
LANG:bash
docker service create --network=monitoring \
  --mount type=volume,target=/usr/share/elasticsearch/data \
  --constraint node.hostname==worker1 \
  --name elasticsearch elasticsearch:2.4.0
Note that the Elasticsearch container is constrained to the worker1 node. This is because it depends on the host where it's running for mounted volumes.
Kibana container
LANG:bash
docker service create --network=monitoring --name kibana -e ELASTICSEARCH_URL="http://elasticsearch:9200" -p 5601:5601 kibana:4.6.0
As you can see, we started both containers telling them to join the monitoring network so the elasticsearch container can be accessed by its name from the services in the same network like Kibana.
Now, thanks to the routing mesh, we can point our browser to any IP address of one of our machines and see the Kibana dashboard status page.
To get the public IP of the controller1 instance:
LANG:bash
docker-machine ip master1
Open your favorite browser and point it to: http://[controller1-ip-address]:5601/status
Everything should be green, like this:
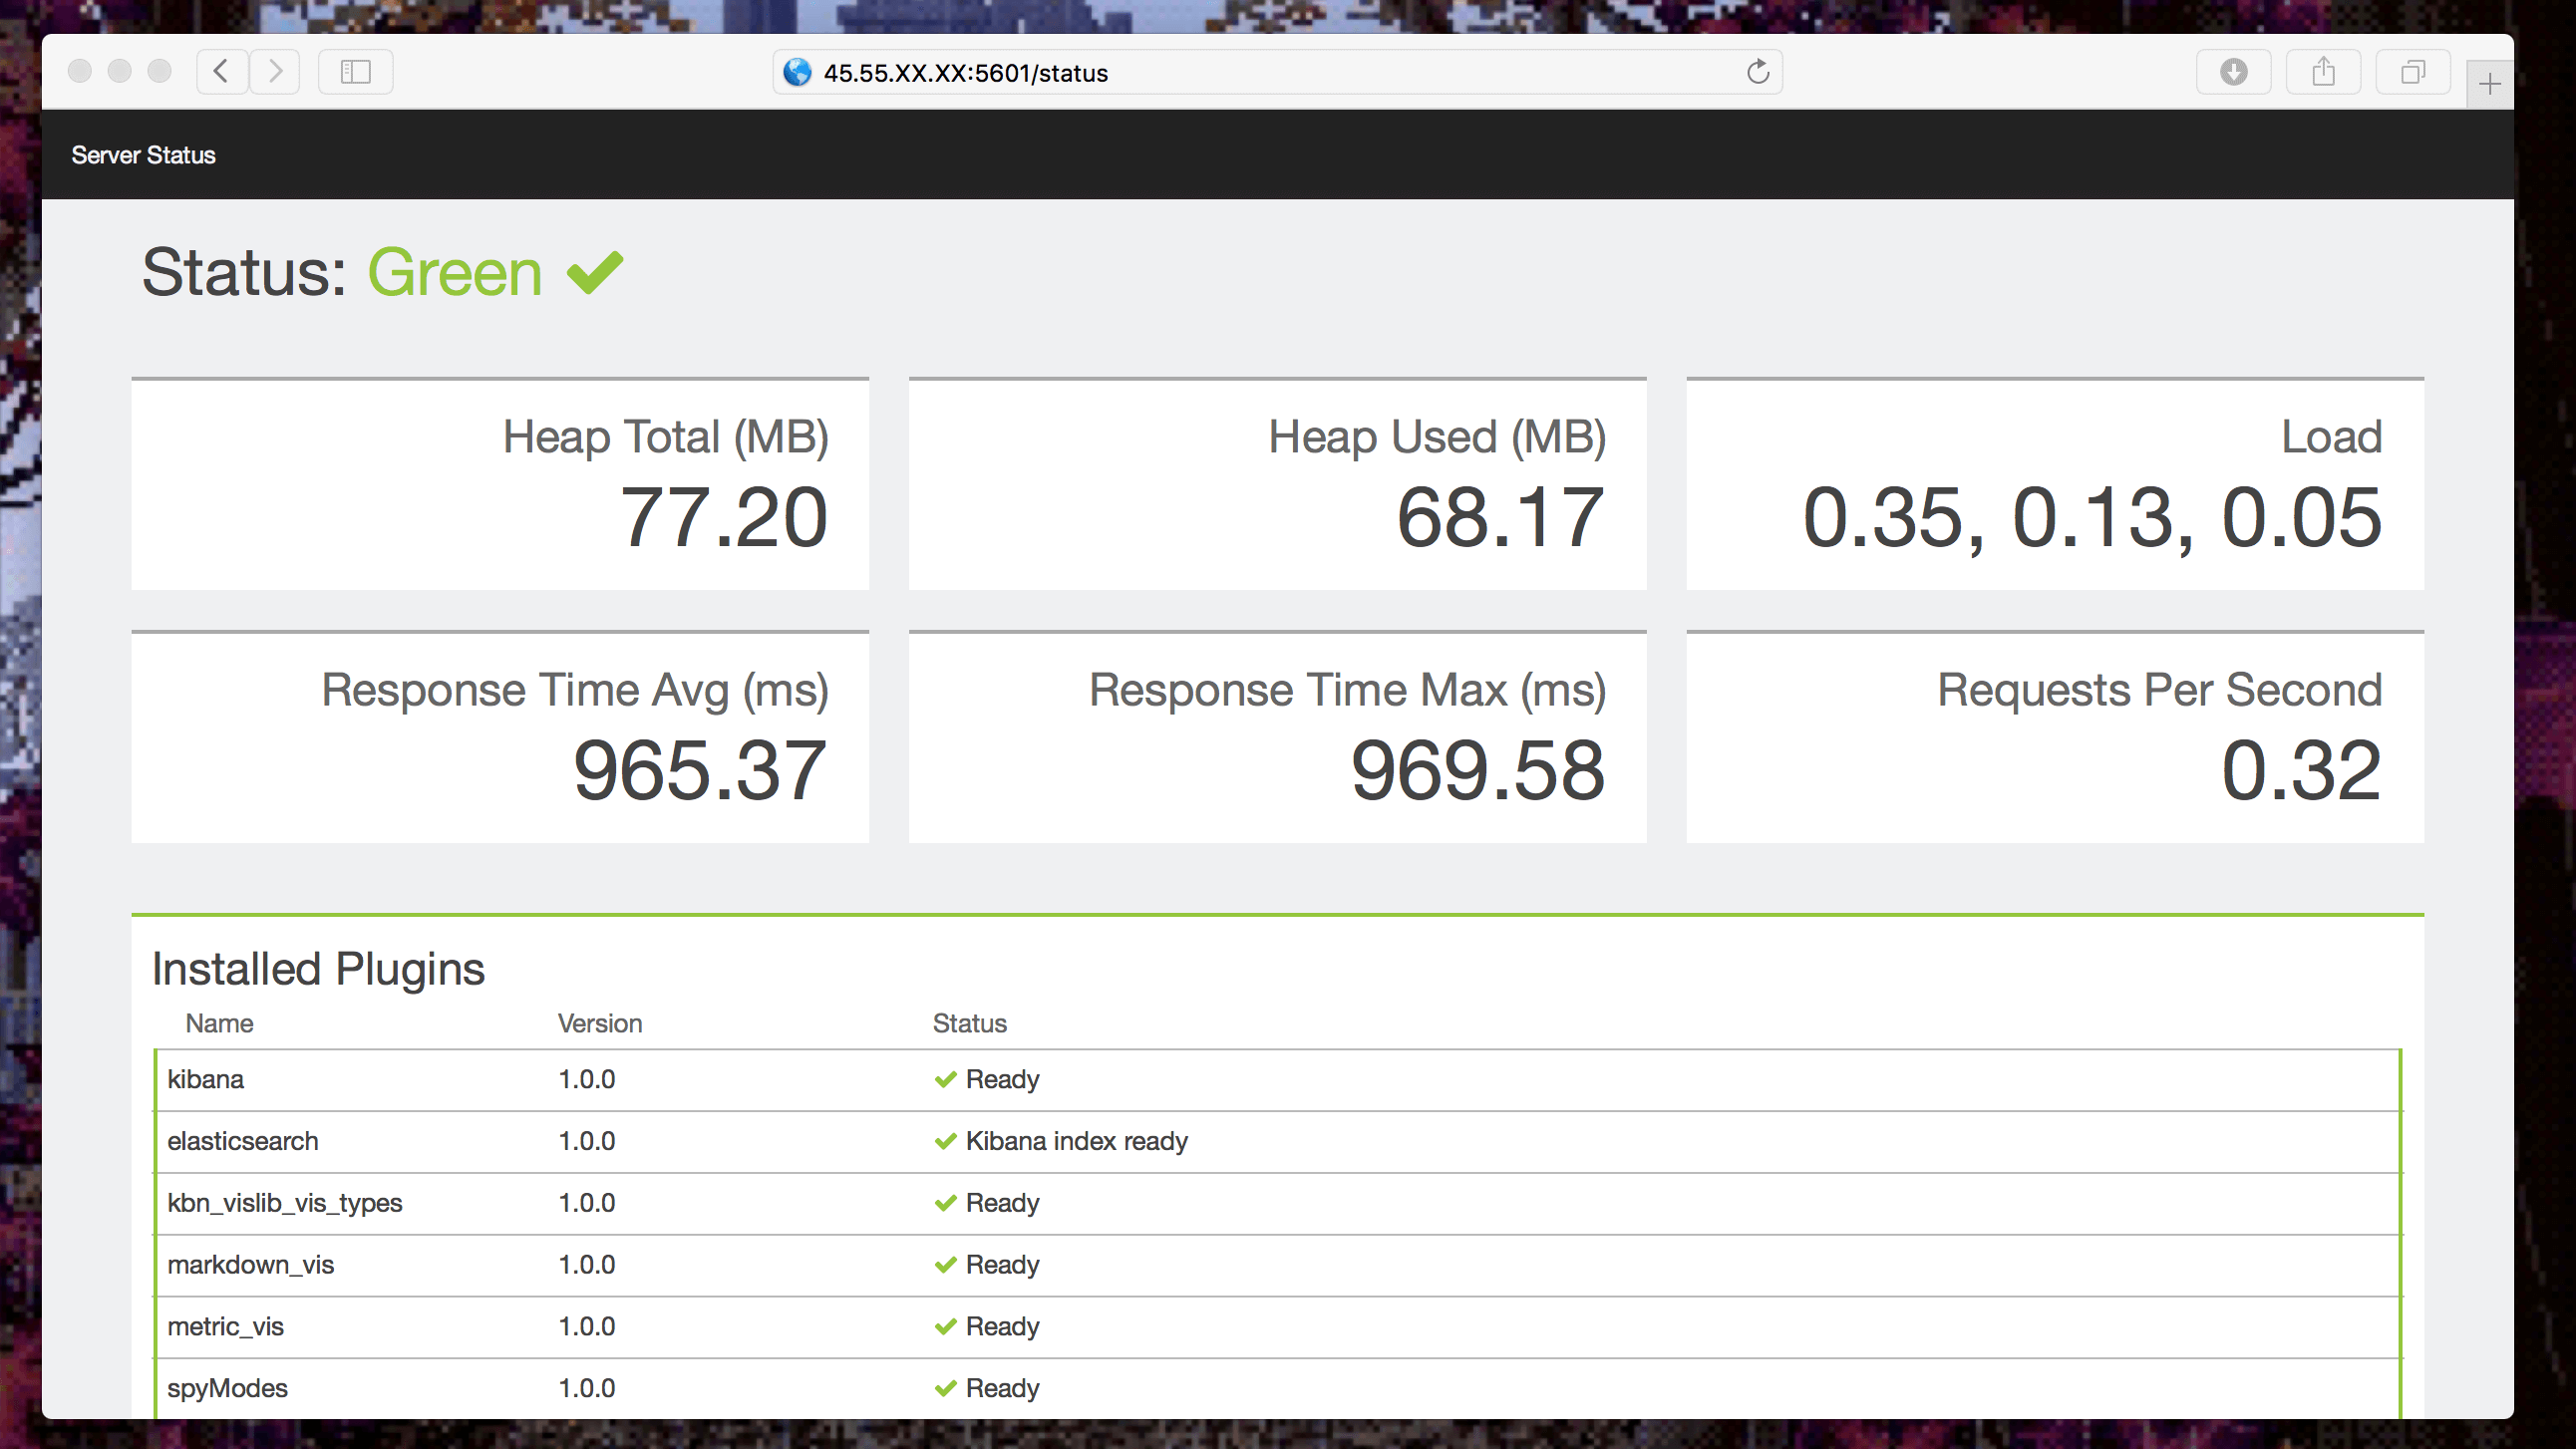
Let's go on and start collecting telemetries!
Collect Metrics on Running Containers
To start gathering metrics on running containers, we'll create a service running cAdvisor in global mode so that the scheduler can place one task on each available node.
This service has to be started in the same network of Elasticsearch so that it can push metrics to it.
LANG:bash
docker service create --network=monitoring --mode global --name cadvisor \
  --mount type=bind,source=/,target=/rootfs,readonly=true \
  --mount type=bind,source=/var/run,target=/var/run,readonly=false \
  --mount type=bind,source=/sys,target=/sys,readonly=true \
  --mount type=bind,source=/var/lib/docker/,target=/var/lib/docker,readonly=true \
  google/cadvisor:latest \
  -storage_driver=elasticsearch \
  -storage_driver_es_host="http://elasticsearch:9200"
Note: If you want to configure cAdvisor options, here's the reference.
Okay, now that cAdvisor is sending metrics to Elasticsearch, we can define how we want to explore that data in Kibana by declaring an index pattern. We can do this in one of two ways: via Kibana OR via API. We'll do that the API way of course!
You have to execute the index creation command in a running container attached to the monitoring network. You can get a shell in the cAdvisor container. Unfortunately Swarm Mode appends a unique id to the name of containers when started as services, so you have to figure out by yourself the name of the cadvisor container.
Get a shell:
LANG:bash
docker exec -ti <cadvisor-container-name> sh
Create the index:
LANG:bash
curl -XPUT http://elasticsearch:9200/.kibana/index-pattern/cadvisor -d '{"title" : "cadvisor*",  "timeFieldName": "container_stats.timestamp"}'
And if you're too lazy, here's a one-liner:
LANG:bash
docker exec $(docker ps | grep cadvisor | awk '{print $1}' | head -1) curl -XPUT http://elasticsearch:9200/.kibana/index-pattern/cadvisor -d '{"title" : "cadvisor*",  "timeFieldName": "container_stats.timestamp"}'
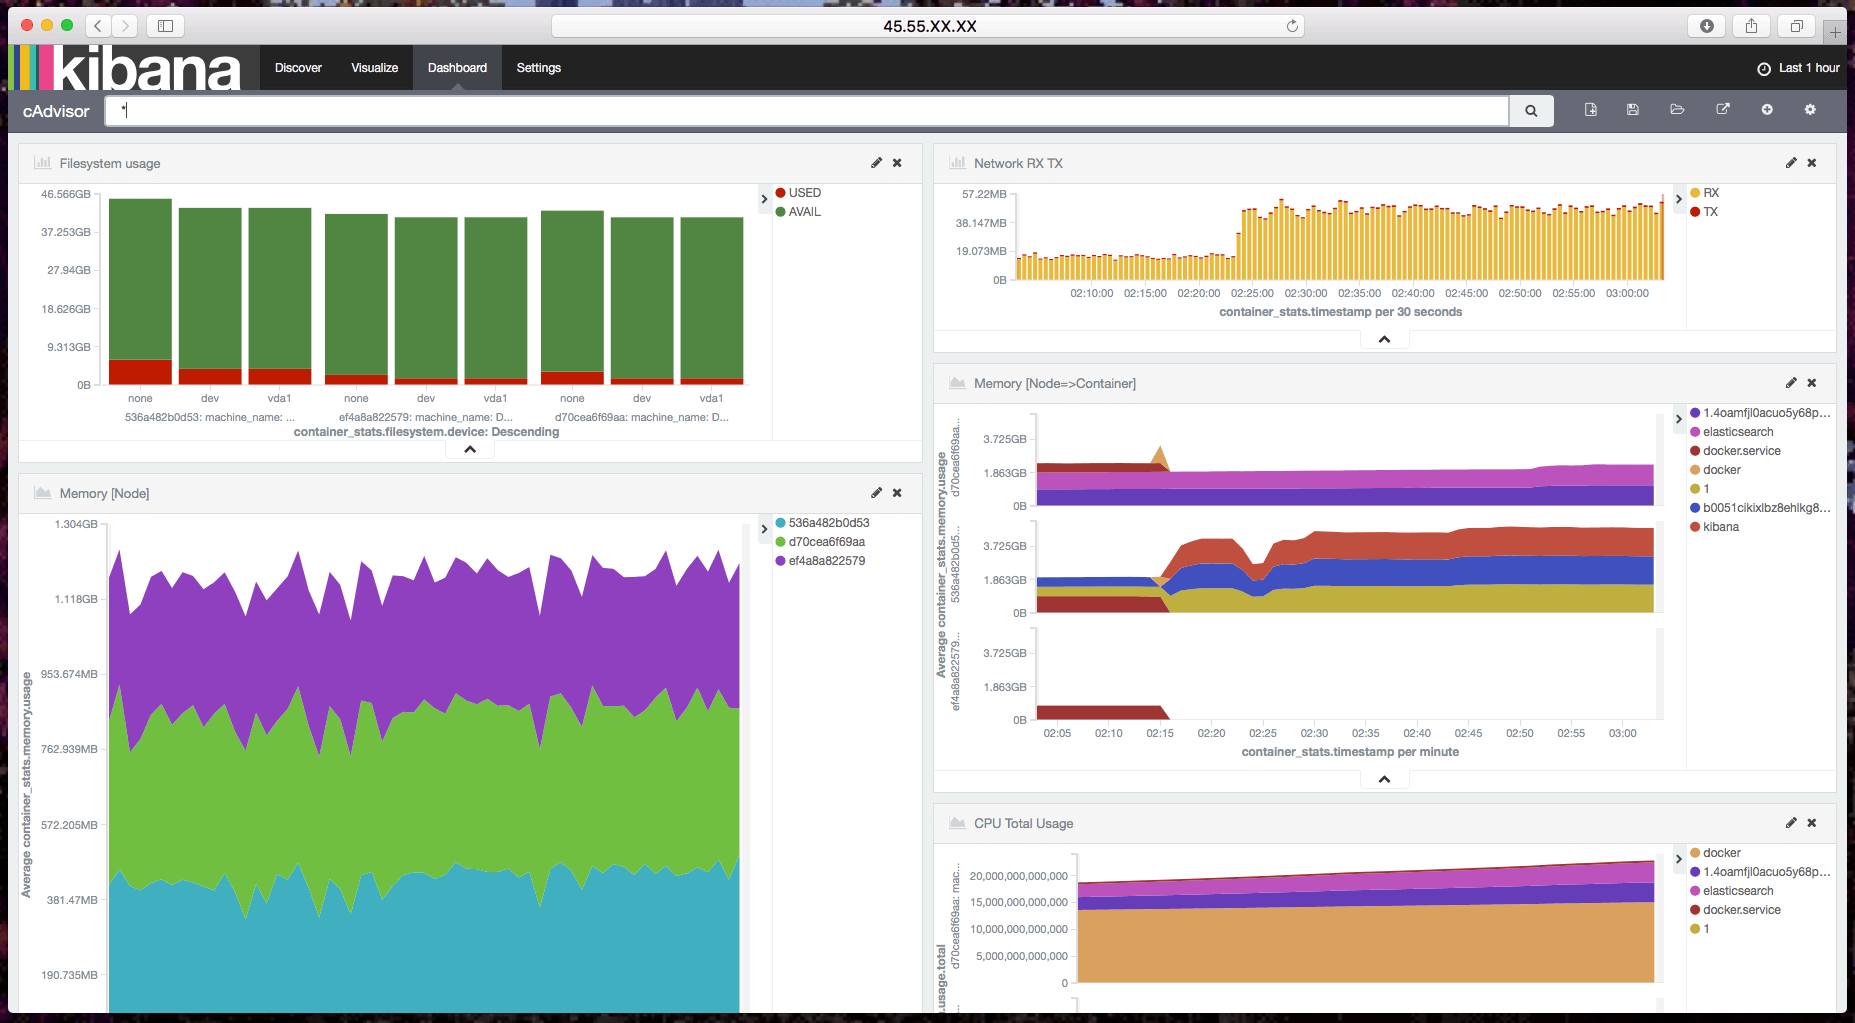
Putting The Pieces Together in a Dashboard
Cool! Now you can go and play with Kibana to create nice visualizations of the gathered metrics. But don't worry. If you're on the fast lane, I created a dashboard and a few visualizations for you as a starting point.
To import my settings, visit your Kibana dashboard and go to Settings => Objects => Import, then select the file where you saved the following JSON:
LANG:json
[
  {
    "_id": "cAdvisor",
    "_type": "dashboard",
    "_source": {
      "title": "cAdvisor",
      "hits": 0,
      "description": "",
      "panelsJSON": "[{\"id\":\"Filesystem-usage\",\"type\":\"visualization\",\"panelIndex\":1,\"size_x\":6,\"size_y\":3,\"col\":1,\"row\":1},{\"id\":\"Memory-[Node-equal->Container]\",\"type\":\"visualization\",\"panelIndex\":2,\"size_x\":6,\"size_y\":4,\"col\":7,\"row\":4},{\"id\":\"memory-usage-by-machine\",\"type\":\"visualization\",\"panelIndex\":3,\"size_x\":6,\"size_y\":6,\"col\":1,\"row\":4},{\"id\":\"CPU-Total-Usage\",\"type\":\"visualization\",\"panelIndex\":4,\"size_x\":6,\"size_y\":5,\"col\":7,\"row\":8},{\"id\":\"Network-RX-TX\",\"type\":\"visualization\",\"panelIndex\":5,\"size_x\":6,\"size_y\":3,\"col\":7,\"row\":1}]",
      "optionsJSON": "{\"darkTheme\":false}",
      "uiStateJSON": "{}",
      "version": 1,
      "timeRestore": false,
      "kibanaSavedObjectMeta": {
        "searchSourceJSON": "{\"filter\":[{\"query\":{\"query_string\":{\"query\":\"*\",\"analyze_wildcard\":true}}}]}"
      }
    }
  },
  {
    "_id": "Network",
    "_type": "search",
    "_source": {
      "title": "Network",
      "description": "",
      "hits": 0,
      "columns": [
        "machine_name",
        "container_Name",
        "container_stats.network.name",
        "container_stats.network.interfaces",
        "container_stats.network.rx_bytes",
        "container_stats.network.rx_packets",
        "container_stats.network.rx_dropped",
        "container_stats.network.rx_errors",
        "container_stats.network.tx_packets",
        "container_stats.network.tx_bytes",
        "container_stats.network.tx_dropped",
        "container_stats.network.tx_errors"
      ],
      "sort": [
        "container_stats.timestamp",
        "desc"
      ],
      "version": 1,
      "kibanaSavedObjectMeta": {
        "searchSourceJSON": "{\"index\":\"cadvisor*\",\"query\":{\"query_string\":{\"analyze_wildcard\":true,\"query\":\"*\"}},\"highlight\":{\"pre_tags\":[\"@kibana-highlighted-field@\"],\"post_tags\":[\"@/kibana-highlighted-field@\"],\"fields\":{\"*\":{}},\"fragment_size\":2147483647},\"filter\":[]}"
      }
    }
  },
  {
    "_id": "Filesystem-usage",
    "_type": "visualization",
    "_source": {
      "title": "Filesystem usage",
      "visState": "{\"title\":\"Filesystem usage\",\"type\":\"histogram\",\"params\":{\"addLegend\":true,\"addTimeMarker\":false,\"addTooltip\":true,\"defaultYExtents\":false,\"mode\":\"stacked\",\"scale\":\"linear\",\"setYExtents\":false,\"shareYAxis\":true,\"times\":[],\"yAxis\":{}},\"aggs\":[{\"id\":\"1\",\"type\":\"avg\",\"schema\":\"metric\",\"params\":{\"field\":\"container_stats.filesystem.usage\",\"customLabel\":\"USED\"}},{\"id\":\"2\",\"type\":\"terms\",\"schema\":\"split\",\"params\":{\"field\":\"machine_name\",\"size\":5,\"order\":\"desc\",\"orderBy\":\"1\",\"row\":false}},{\"id\":\"3\",\"type\":\"avg\",\"schema\":\"metric\",\"params\":{\"field\":\"container_stats.filesystem.capacity\",\"customLabel\":\"AVAIL\"}},{\"id\":\"4\",\"type\":\"terms\",\"schema\":\"segment\",\"params\":{\"field\":\"container_stats.filesystem.device\",\"size\":5,\"order\":\"desc\",\"orderBy\":\"1\"}}],\"listeners\":{}}",
      "uiStateJSON": "{\"vis\":{\"colors\":{\"Average container_stats.filesystem.available\":\"#E24D42\",\"Average container_stats.filesystem.base_usage\":\"#890F02\",\"Average container_stats.filesystem.capacity\":\"#3F6833\",\"Average container_stats.filesystem.usage\":\"#E24D42\",\"USED\":\"#BF1B00\",\"AVAIL\":\"#508642\"}}}",
      "description": "",
      "version": 1,
      "kibanaSavedObjectMeta": {
        "searchSourceJSON": "{\"index\":\"cadvisor*\",\"query\":{\"query_string\":{\"analyze_wildcard\":true,\"query\":\"*\"}},\"filter\":[]}"
      }
    }
  },
  {
    "_id": "CPU-Total-Usage",
    "_type": "visualization",
    "_source": {
      "title": "CPU Total Usage",
      "visState": "{\"title\":\"CPU Total Usage\",\"type\":\"area\",\"params\":{\"shareYAxis\":true,\"addTooltip\":true,\"addLegend\":true,\"smoothLines\":false,\"scale\":\"linear\",\"interpolate\":\"linear\",\"mode\":\"stacked\",\"times\":[],\"addTimeMarker\":false,\"defaultYExtents\":false,\"setYExtents\":false,\"yAxis\":{}},\"aggs\":[{\"id\":\"1\",\"type\":\"avg\",\"schema\":\"metric\",\"params\":{\"field\":\"container_stats.cpu.usage.total\"}},{\"id\":\"2\",\"type\":\"date_histogram\",\"schema\":\"segment\",\"params\":{\"field\":\"container_stats.timestamp\",\"interval\":\"auto\",\"customInterval\":\"2h\",\"min_doc_count\":1,\"extended_bounds\":{}}},{\"id\":\"3\",\"type\":\"terms\",\"schema\":\"group\",\"params\":{\"field\":\"container_Name\",\"size\":5,\"order\":\"desc\",\"orderBy\":\"1\"}},{\"id\":\"4\",\"type\":\"terms\",\"schema\":\"split\",\"params\":{\"field\":\"machine_name\",\"size\":5,\"order\":\"desc\",\"orderBy\":\"1\",\"row\":true}}],\"listeners\":{}}",
      "uiStateJSON": "{}",
      "description": "",
      "version": 1,
      "kibanaSavedObjectMeta": {
        "searchSourceJSON": "{\"index\":\"cadvisor*\",\"query\":{\"query_string\":{\"query\":\"*\",\"analyze_wildcard\":true}},\"filter\":[]}"
      }
    }
  },
  {
    "_id": "memory-usage-by-machine",
    "_type": "visualization",
    "_source": {
      "title": "Memory [Node]",
      "visState": "{\"title\":\"Memory [Node]\",\"type\":\"area\",\"params\":{\"shareYAxis\":true,\"addTooltip\":true,\"addLegend\":true,\"smoothLines\":false,\"scale\":\"linear\",\"interpolate\":\"linear\",\"mode\":\"stacked\",\"times\":[],\"addTimeMarker\":false,\"defaultYExtents\":false,\"setYExtents\":false,\"yAxis\":{}},\"aggs\":[{\"id\":\"1\",\"type\":\"avg\",\"schema\":\"metric\",\"params\":{\"field\":\"container_stats.memory.usage\"}},{\"id\":\"2\",\"type\":\"date_histogram\",\"schema\":\"segment\",\"params\":{\"field\":\"container_stats.timestamp\",\"interval\":\"auto\",\"customInterval\":\"2h\",\"min_doc_count\":1,\"extended_bounds\":{}}},{\"id\":\"3\",\"type\":\"terms\",\"schema\":\"group\",\"params\":{\"field\":\"machine_name\",\"size\":5,\"order\":\"desc\",\"orderBy\":\"1\"}}],\"listeners\":{}}",
      "uiStateJSON": "{}",
      "description": "",
      "version": 1,
      "kibanaSavedObjectMeta": {
        "searchSourceJSON": "{\"index\":\"cadvisor*\",\"query\":{\"query_string\":{\"query\":\"*\",\"analyze_wildcard\":true}},\"filter\":[]}"
      }
    }
  },
  {
    "_id": "Network-RX-TX",
    "_type": "visualization",
    "_source": {
      "title": "Network RX TX",
      "visState": "{\"title\":\"Network RX TX\",\"type\":\"histogram\",\"params\":{\"addLegend\":true,\"addTimeMarker\":true,\"addTooltip\":true,\"defaultYExtents\":false,\"mode\":\"stacked\",\"scale\":\"linear\",\"setYExtents\":false,\"shareYAxis\":true,\"times\":[],\"yAxis\":{}},\"aggs\":[{\"id\":\"1\",\"type\":\"avg\",\"schema\":\"metric\",\"params\":{\"field\":\"container_stats.network.rx_bytes\",\"customLabel\":\"RX\"}},{\"id\":\"2\",\"type\":\"date_histogram\",\"schema\":\"segment\",\"params\":{\"field\":\"container_stats.timestamp\",\"interval\":\"s\",\"customInterval\":\"2h\",\"min_doc_count\":1,\"extended_bounds\":{}}},{\"id\":\"3\",\"type\":\"avg\",\"schema\":\"metric\",\"params\":{\"field\":\"container_stats.network.tx_bytes\",\"customLabel\":\"TX\"}}],\"listeners\":{}}",
      "uiStateJSON": "{\"vis\":{\"colors\":{\"RX\":\"#EAB839\",\"TX\":\"#BF1B00\"}}}",
      "description": "",
      "savedSearchId": "Network",
      "version": 1,
      "kibanaSavedObjectMeta": {
        "searchSourceJSON": "{\"filter\":[]}"
      }
    }
  },
  {
    "_id": "Memory-[Node-equal->Container]",
    "_type": "visualization",
    "_source": {
      "title": "Memory [Node=>Container]",
      "visState": "{\"title\":\"Memory [Node=>Container]\",\"type\":\"area\",\"params\":{\"shareYAxis\":true,\"addTooltip\":true,\"addLegend\":true,\"smoothLines\":false,\"scale\":\"linear\",\"interpolate\":\"linear\",\"mode\":\"stacked\",\"times\":[],\"addTimeMarker\":false,\"defaultYExtents\":false,\"setYExtents\":false,\"yAxis\":{}},\"aggs\":[{\"id\":\"1\",\"type\":\"avg\",\"schema\":\"metric\",\"params\":{\"field\":\"container_stats.memory.usage\"}},{\"id\":\"2\",\"type\":\"date_histogram\",\"schema\":\"segment\",\"params\":{\"field\":\"container_stats.timestamp\",\"interval\":\"auto\",\"customInterval\":\"2h\",\"min_doc_count\":1,\"extended_bounds\":{}}},{\"id\":\"3\",\"type\":\"terms\",\"schema\":\"group\",\"params\":{\"field\":\"container_Name\",\"size\":5,\"order\":\"desc\",\"orderBy\":\"1\"}},{\"id\":\"4\",\"type\":\"terms\",\"schema\":\"split\",\"params\":{\"field\":\"machine_name\",\"size\":5,\"order\":\"desc\",\"orderBy\":\"1\",\"row\":true}}],\"listeners\":{}}",
      "uiStateJSON": "{}",
      "description": "",
      "version": 1,
      "kibanaSavedObjectMeta": {
        "searchSourceJSON": "{\"index\":\"cadvisor*\",\"query\":{\"query_string\":{\"query\":\"* NOT container_Name.raw: \\\\\\\"/\\\\\\\" AND NOT container_Name.raw: \\\\\\\"/docker\\\\\\\"\",\"analyze_wildcard\":true}},\"filter\":[]}"
      }
    }
  }
]
There are a lot of fields to play with, so you may want to customize the dashboard to add Memory Page faulting insights or RX/TX dropped packets for example. Also it would be nice if you can address the missing points from my previous list.
Conclusion
Monitoring the right way requires a lot of time and effort. Monitoring CPU, memory, IO, network, and disk of containers is just a drop in the sea.
I don't know where you are personally in the process, but next steps might be:
- Aggregating logs from running containers
- Aggregating logs from applications
- Application performance monitoring
- Alerting
- State/Health check monitoring
If you have hints or advice, please share in the comments! Good luck with your setup!
And now, shut down your test infrastructure:
LANG:bash
docker-machine rm master1 worker{1,2}
Posts you may also find interesting:
- Docker’s Restart Policy: Ensure Containers Always Run
- Docker & Rails: Running a Rails Development Environment in Docker
- Docker Hosting: The Best Cloud Hosting Providers for Docker
- Docker & Ruby: Build a Minimal Docker Container for Ruby Apps
- Docker Continuous Integration: CI & Delivery with Docker
- Running a MEAN web application in Docker containers on AWS
- Docker Machine Compose & Swarm Tutorials
- Docker Compose Tutorial: Orchestrate Containers for Development
- Tutum (aka Docker Cloud) Tutorial: Setup Code & Deployment
- Understanding Docker's CMD and ENTRYPOINT Instructions
- Docker: How to Stop and Remove All Containers at Once
- How to Kill All Containers in Docker
- Docker Expose Port: What it Means