RESTful, JSON-delivering APIs are today's default choice when building an API. However, there's a new API kid on the block that's generating considerable attention: GraphQL.
GraphQL is an entirely new way to consume and build APIs. Done right, you can build wonderfully tight integrations that aren't possible with REST APIs. Today, we'll get firsthand exposure to GraphQL via the GitHub GraphQL API.
Before we start coding, let's explore why companies like GitHub, Facebook, and Pinterest are releasing GraphQL APIs.
The Origins of GraphQL
In 2012, Facebook began an effort to rebuild their native mobile apps and quickly ran into a major source of frustration.
The Facebook mobile team required a JSON version of the news feed so it could be rendered with native components. However, there were significant differences between how the news feed data was stored and how product designers and developers consumed that data.
Frequently, developers like me think of data as a graph of objects. For example, I might represent the data presented on the Codeship blog like this:
LANG:code
blog(name: 'codeship') {
  title
  feedUrl
  posts(last: 10) {
    title
    url
    commentsCount
    favorites {
      id
      avatar_url
    }
  }
}
However, data is typically not query-able -- much less stored -- in an easy-to-consume graph format. If the data is available in a REST API, it may require multiple API calls (for example, a separate HTTP call to fetch comment details for every post rendered on the page). Additionally, I can rarely specify only the data I need with a REST API: Instead, I'll typically get a dump of everything available for each record.
Multiple HTTP calls? Sending excessive amounts of data across the wire? These are huge burdens when you want to deliver fast-responding interactions. On mobile -- which was Facebook's focus -- these problems are compounded.
To solve this problem, Facebook's engineering team developed GraphQL. GraphQL approaches data-fetching from the perspective of product designers and developers.
Enter GraphQL
After three years of internal use, Facebook released a working draft of the GraphQL spec in 2015. APIs that conform to this spec can be queried via a graph syntax similar to the sample above. The server-side runtime for executing GraphQL queries doesn't tie you to a particular storage engine: It's an application-level API, not a database.
Today, companies like GitHub, Pinterest, and Shopify have released GraphQL APIs.
What Problems Does GraphQL Solve Versus REST?
These are the some of the key GraphQL features and the problems they solve:
- Get exactly what you ask for: Your queries mirror the shape of data returned from a GraphQL API, so there's no confusion over which fields an API call returns.
- Nesting: Graph queries can be nested, so you can fetch data across relationships. Without GraphQL, gathering data across relationships typically involves multiple, slower, HTTP calls.
- Strongly typed: It's important to get the data format you expect when working with an external data source. GraphQL is strongly typed, so you get these guarantees.
- Introspective: Since a GraphQL server can be queried for the calls it supports, you can use tools like GraphiQL to organically explore versus hunting through API docs.
- No versioning: Since you get what ask for, fields won't be added or removed out from under you. When fields are deprecated, they can be marked as such to provide advance warning.
Let's Solve a Problem with GraphQL
Let's say I have an idea for a GitHub integration: Given a specific GitHub repository, maintain a leader board of which developers are most active commenting on pull requests, and keep your codebase up-to-date by using git pull before running the query.
The output should look like:
+--------------------------+----------+ | Author | Comments | +--------------------------+----------+ | Richard | 65 | | Derek | 23 | | Josh | 21 | | ... | ... | +--------------------------+----------+
Set up your GraphQL environment
We'll get things going on the GitHub side (sign up for early access and generate an access token) and install GraphiQL.app, a GraphQL query editor.
Sign up with GitHub's early access program
The GitHub's GraphQL library is in their early access program, which requires acknowledgment to join. Accept the prerelease agreement to sign up.
Generate a GitHub personal access token
We will authenticate to GitHub's GraphQL API via a personal access token. Follow the steps in the GitHub guide, enabling the following scopes:
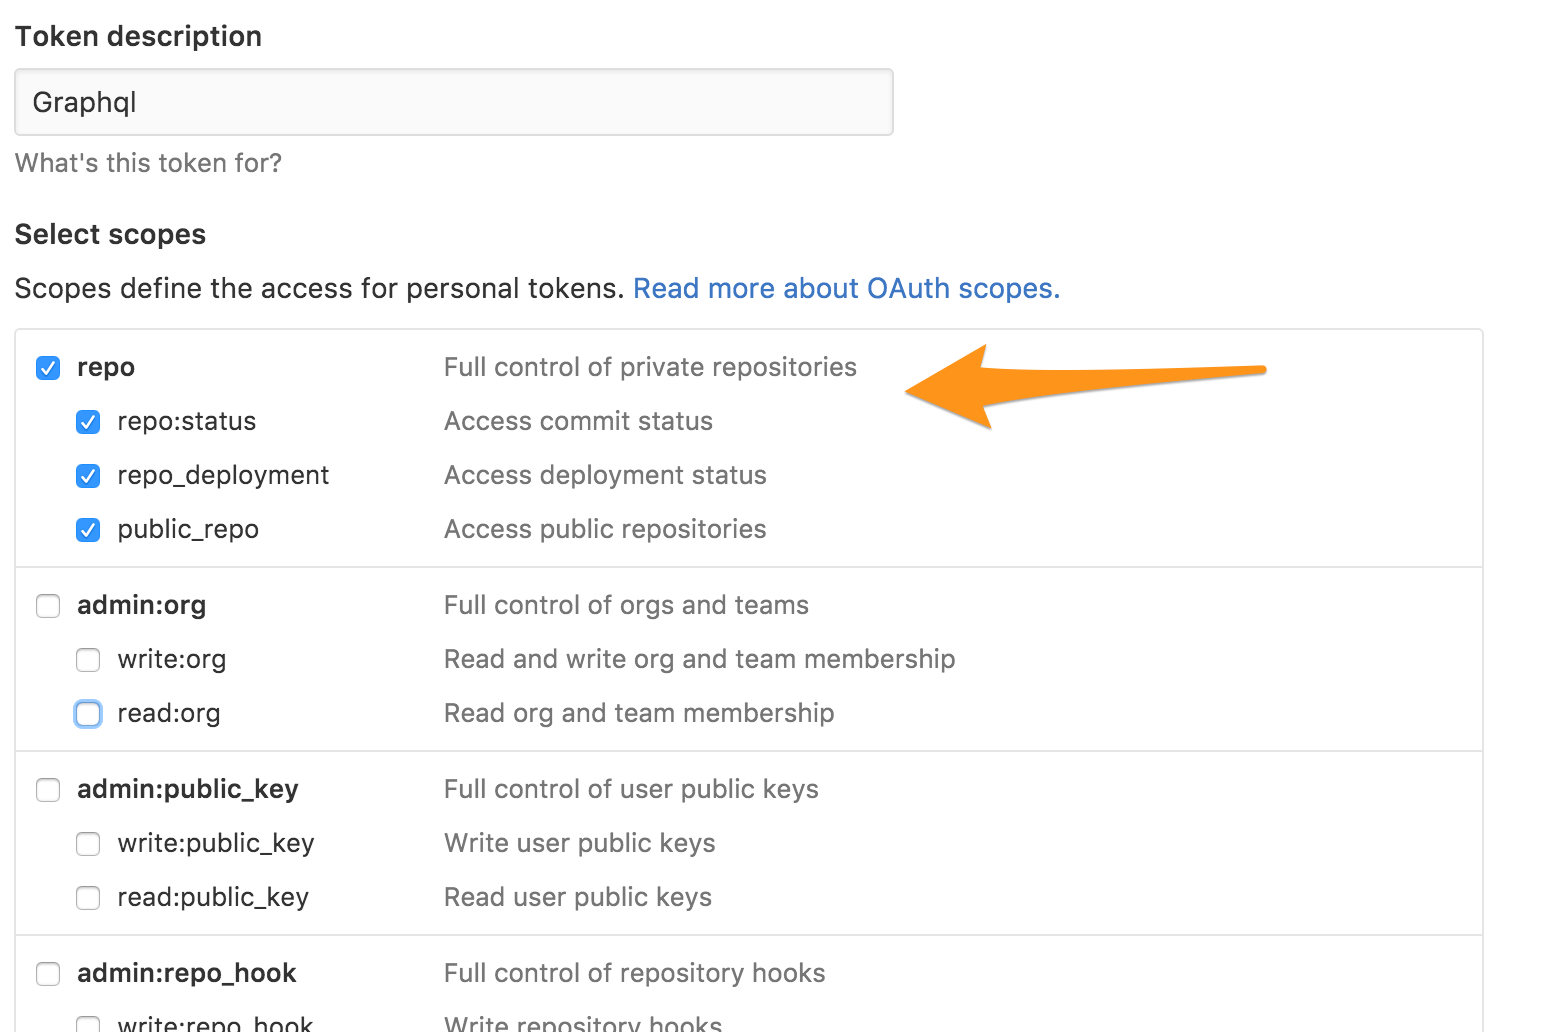
Copy the generated access token to your clipboard.
Install GraphiQL.app
GraphiQL.app is a lightweight wrapper around GraphiQL, an interactive in-browser IDE for GraphQL. GraphiQL makes it easy to explore GraphQL APIs like GitHub's.
View the GraphiQL.app README for installation instructions.
Configure GraphiQL to use GitHub
There are two pieces we need to configure with GraphiQL to use the GitHub API:
- Add our previously generated personal access token to request headers.
- Provide the URL to the GitHub GraphQL API endpoint.
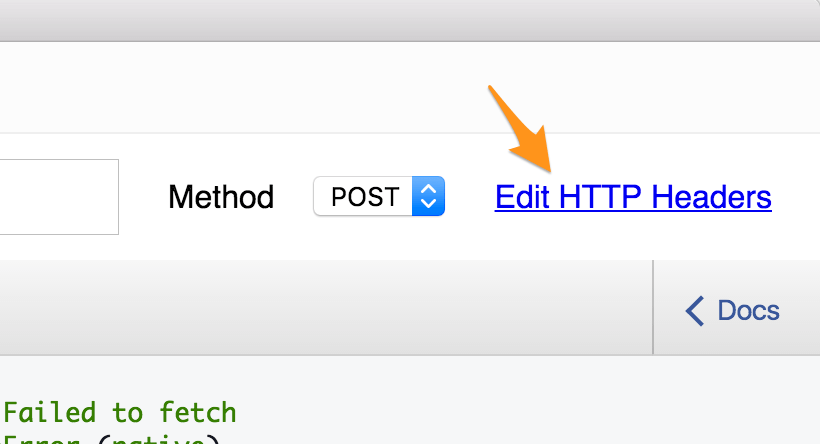
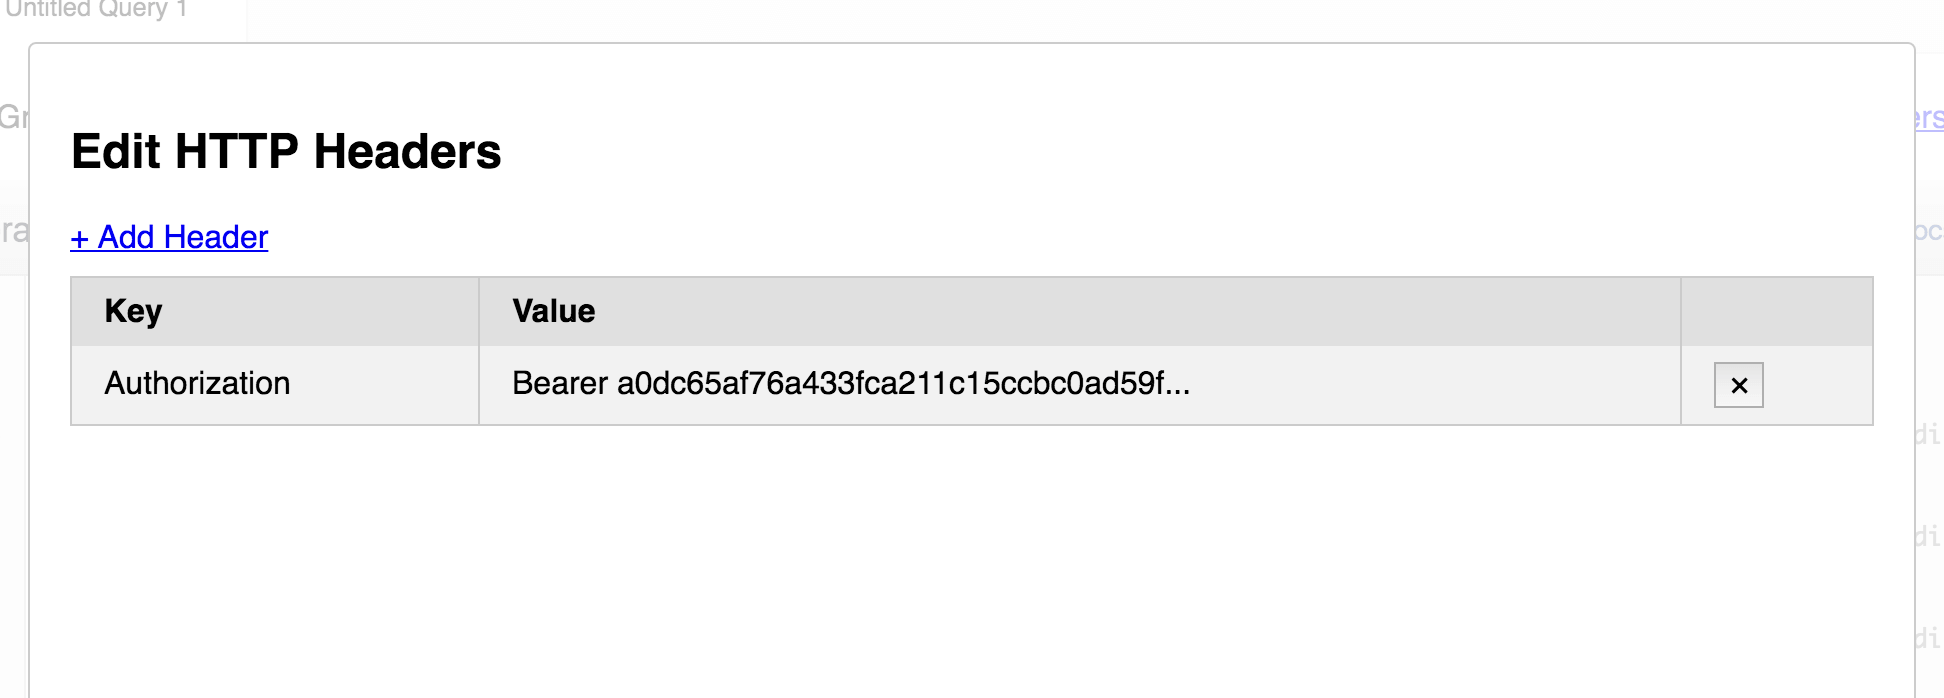
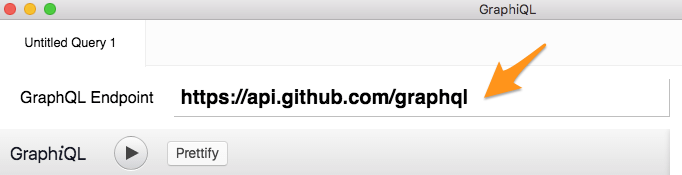
Let's start with the request headers. Click the Edit HTTP Headers link in the upper right.
Add a header with key Authorization and a value with Bearer #{TOKEN}, where token is the personal access token you generated earlier.
It's not intuitive, but click outside the Edit HTTP Headers panel to close the panel and return to the editor.
Finally, enter https://api.github.com/graphql as the GraphQL endpoint:
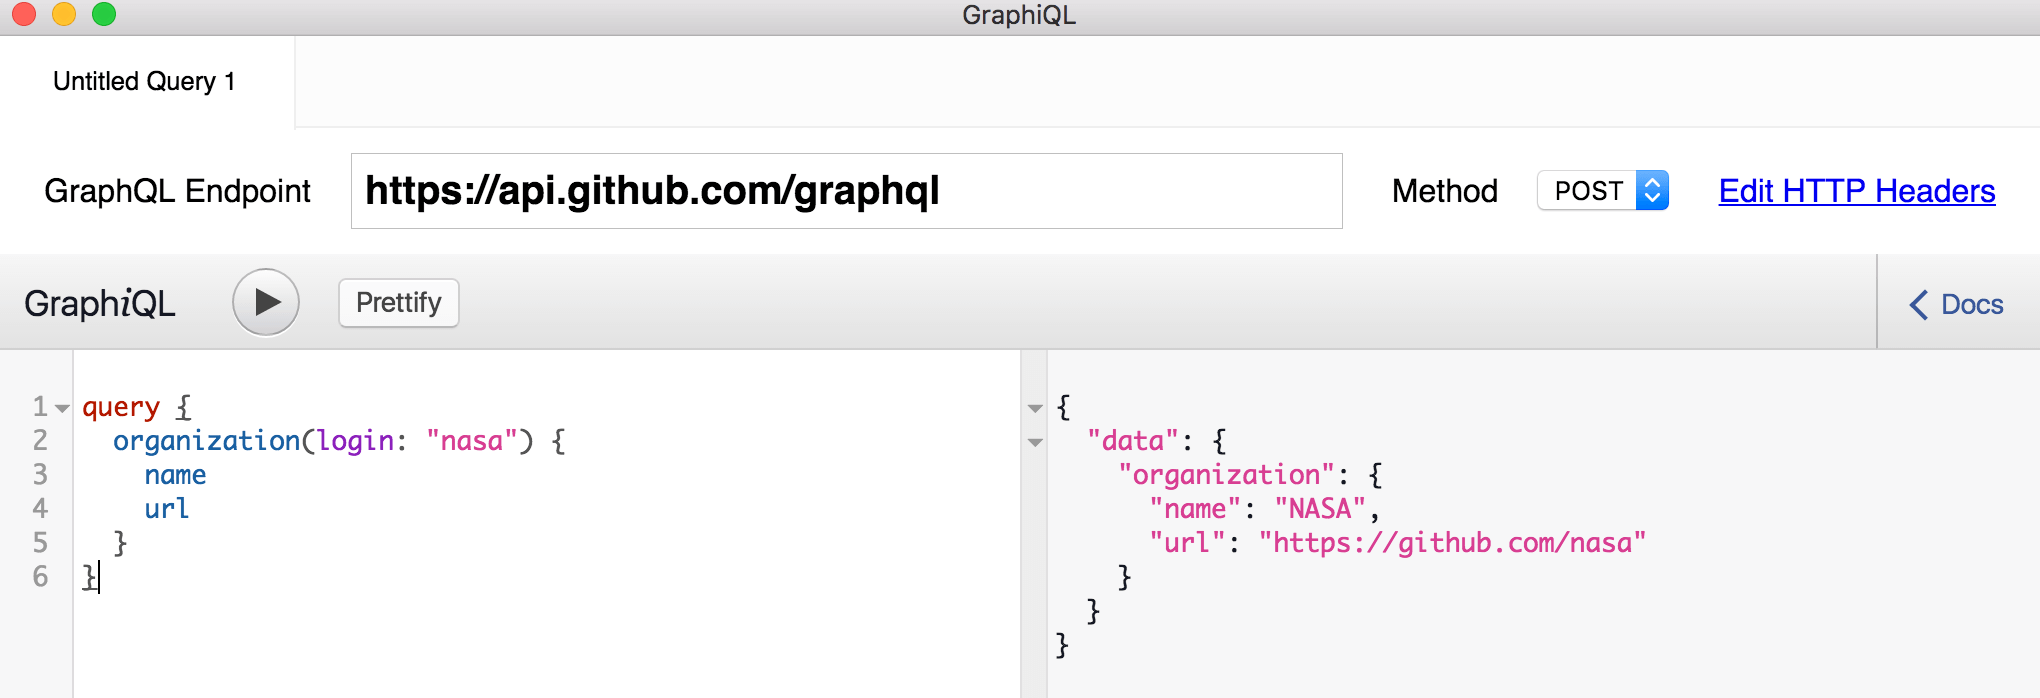
Test your configuration
Let's ensure we're ready to go. Copy and paste the following query:
LANG:code
query {
  organization(login: "nasa") {
    name
    url
  }
}
You should see high-level information on NASA's GitHub organization:
Data hierarchy
Back to our problem: showing the most active pull request comment authors. To get down to this data, we'll need to access data through several nested relationships:
organization => repository => pull requests => => comments
We'll step through this one-by-one below. Don't worry: It's not as complex as it might look above.
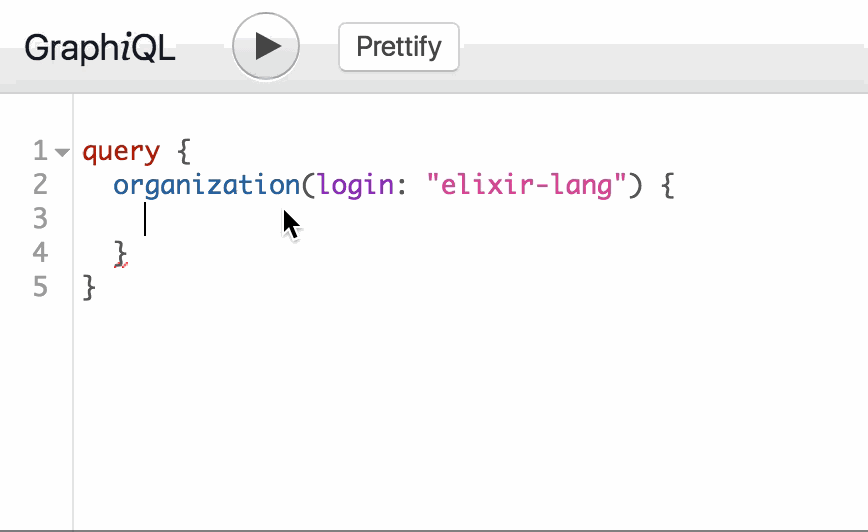
Fetch a GitHub organization
I'm going to fetch data from the Ruby on Rails repository on GitHub. To start, we'll need to access the rails organization:
LANG:code
query {
  organization(login: "rails") {
    name
    url
  }
}
Pasting the query above should generate output like this:
LANG:json
{
  "data": {
    "organization": {
      "name": "Ruby on Rails",
      "url": "https://github.com/rails"
    }
In the example above, organization is an object. The organization's name and url are fields. Notice we only get the fields we've asked for. By comparison, if we used the GitHub REST API, more than 30 fields would be returned with information on the organization.
The organization login is an argument. These are the REST equivalent of query parameters, but more magical. Any object or field can have its own set of arguments: This is one of the ways GraphQL can eliminate multiple HTTP calls versus REST when fetching data. I'll demonstrate this shortly.
Notice that as you type in GraphiQL, suggestions are provided. This is the introspective nature of GraphQL:
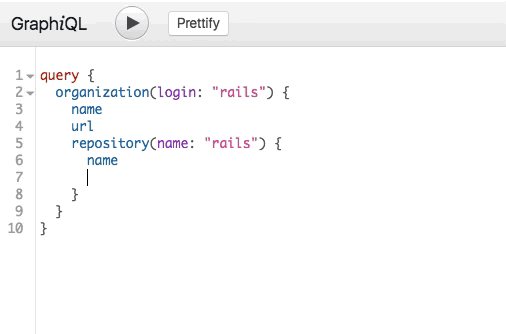
Fetch the rails repository
We'll find the rails repository in a similar nature as the Rails organization. Since a repository belongs to an organization, it is nested under an organization in a GraphQL query:
LANG:code
query {
  organization(login: "rails") {
    name
    url
    repository(name: "rails") {
      name
    }
  }
}
The output should look like:
LANG:json
{
  "data": {
    "organization": {
      "name": "Ruby on Rails",
      "url": "https://github.com/rails",
      "repository": {
        "name": "rails"
      }
    }
  }
}
We can see the start of the GraphQL magic forming: We've now queried across two associated objects (organizations and repositories). We also have a much leaner payload: Fetching a repository with the GitHub REST API may return a response with nearly 300 lines.
Fetch pull requests
Pull requests belong to repositories, so these are nested under a repository in the query. We'll fetch the last ten pull requests. Nest the following under repository and execute the query:
pullRequests(last: 10)
Notice how GraphiQL automatically added the leaf fields under pullRequests after the query was executed:
This makes exploring a GraphQL API very organic.
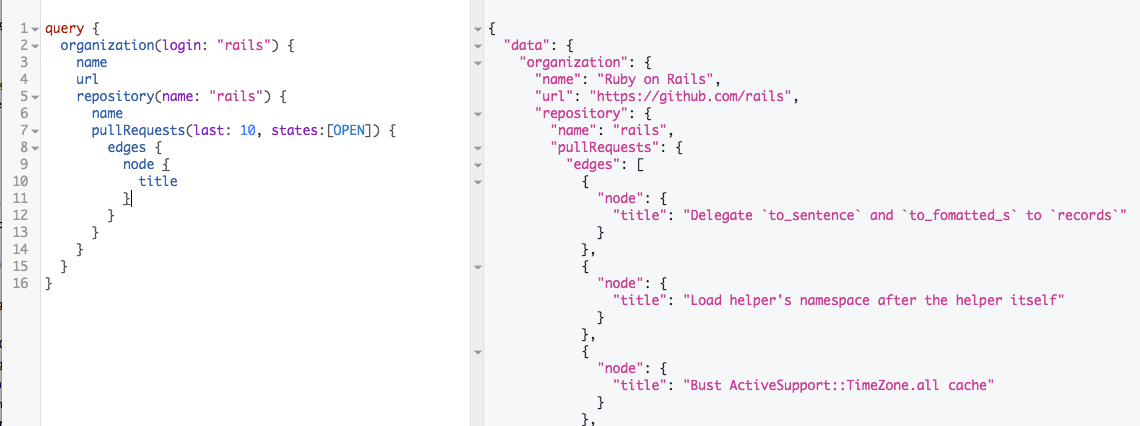
Let's fetch the title of each PR and remove the PR id field:
LANG:code
pullRequests(last: 10) {
  edges {
    node {
      title
    }
  }
}
Now, let's just grab open PRs. Go back to pullRequests(last: 10) in GraphiQL and let's add a new argument.
Start typing states. GraphiQL shows states as a valid argument, but I'm unfamiliar with the PullRequestState type. Just click it, and the docs will appear in the sidebar.
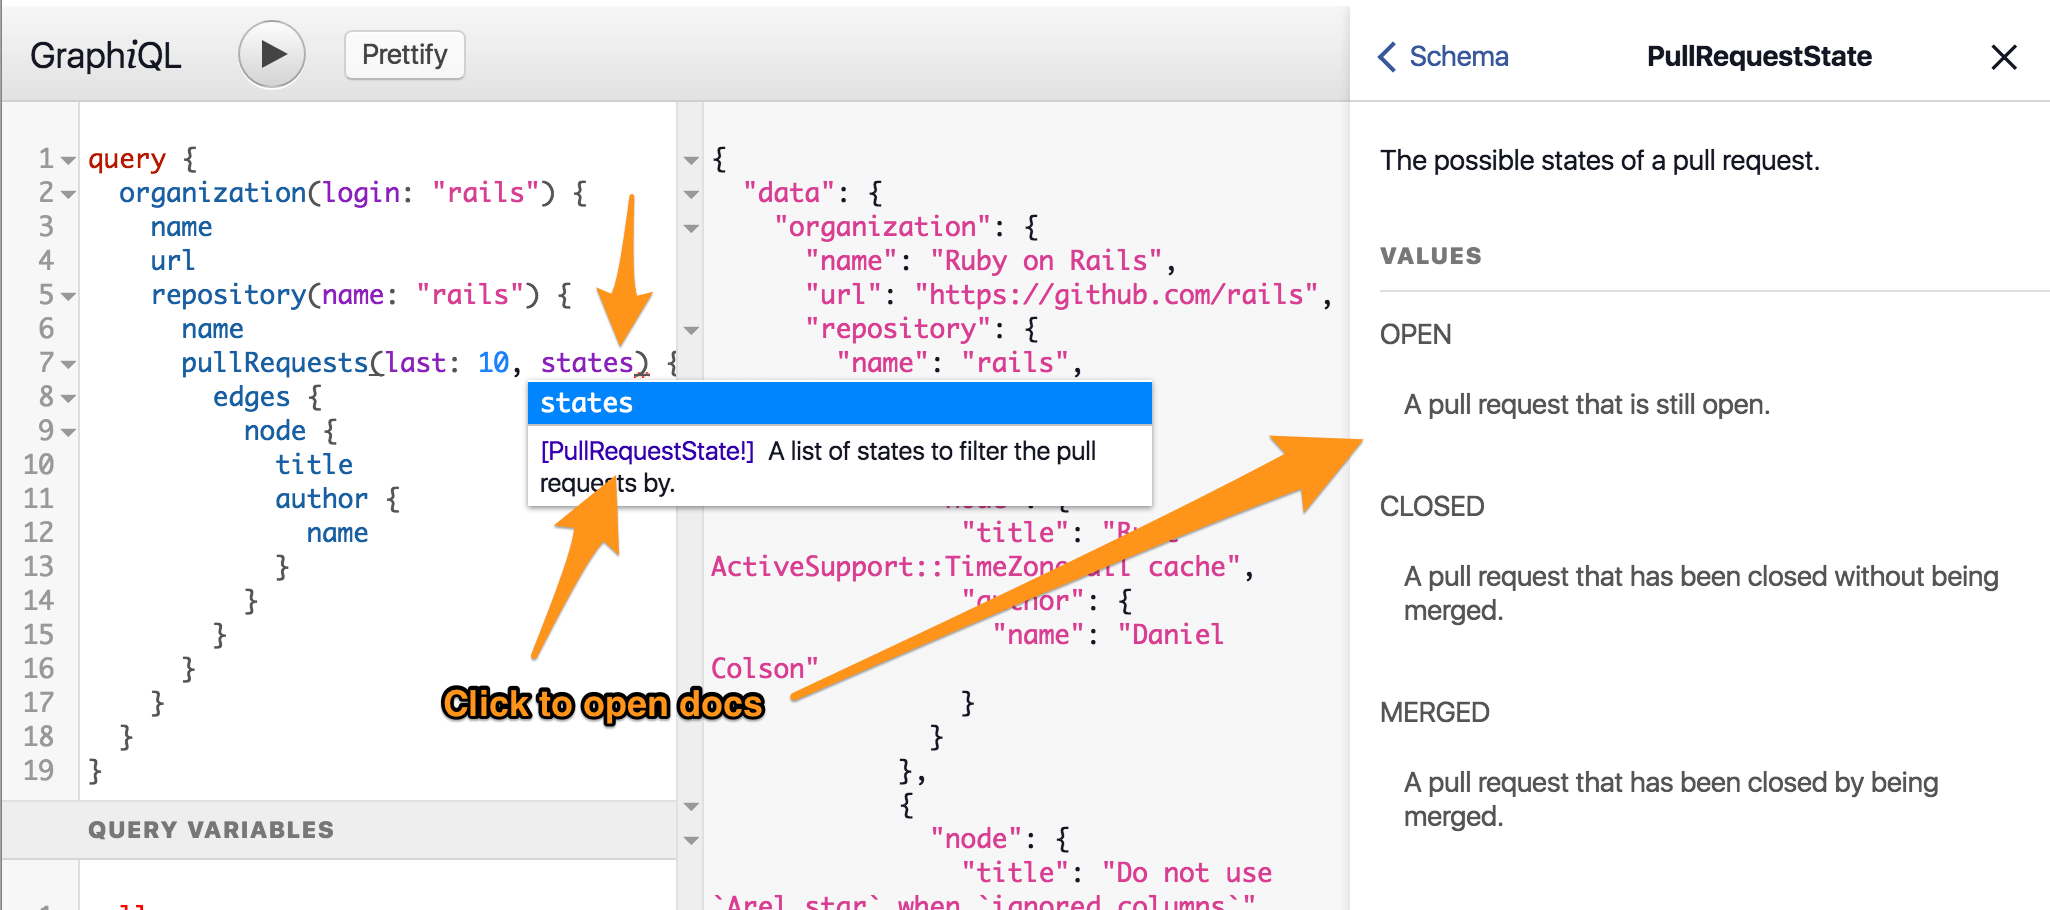
Again, the introspective nature of GraphQL is super helpful. We're able to focus on building our query and accessing docs as we need them.
So, let's just specify OPEN pull requests:
pullRequests(last: 10, states: [OPEN])
Comments
We're mixing and repeating at this point: The format is similar to what we've already done. We'll grab pull request comments. This completes our first working GraphQL query!
LANG:code
{
  organization(login: "rails") {
    name
    url
    repository(name: "rails") {
      name
      pullRequests(last: 10, states: [OPEN]) {
        edges {
          node {
            title
            comments(last: 10) {
              edges {
                node {
                  author {
                    name
                  }
                }
              }
            }
          }
        }
      }
    }
  }
}
How Would We Gather the Same Data via GitHub's REST API?
If I'm using the existing GitHub API, I'd need to assemble a number of requests to gather this data: fetching an org, fetching a repo, fetching open pull requests, and fetching comments for each pull request.
This is pretty inefficient. Not only does this require many HTTP calls, but each response sends a significant amount of information that we aren't using. Additionally, I'd have no choice but to navigate the REST API docs to determine endpoints and possible query params. With GraphiQL, you may never have to leave the app to generate the query.
Queries are like view templates
If you inspect our working query above, you'll notice there are several places where I've hard-coded argument values: the organization login, the repository name, the number of pull requests to fetch, etc. This doesn't make the query easily reusable if we'd like to fetch the same information from other repositories.
GraphQL has a number of ways to address this. In general, you should think of GraphQL queries just like you think of view templates.
Variables
GraphQL has first-class support for variables, so we can remove these hard-coded values (organization login, repository name, etc.) from the query.
There are three steps to use variables in GraphQL queries. I can't say it any better than the GraphQL docs, so I've placed the steps below:
- Replace the static value in the query with
$variableName. - Declare
$variableNameas one of the variables accepted by the query. - Pass
variableName: valuein the separate, transport-specific (usually JSON) variables dictionary.
Here's how the GitHub query looks now in GraphiQL:
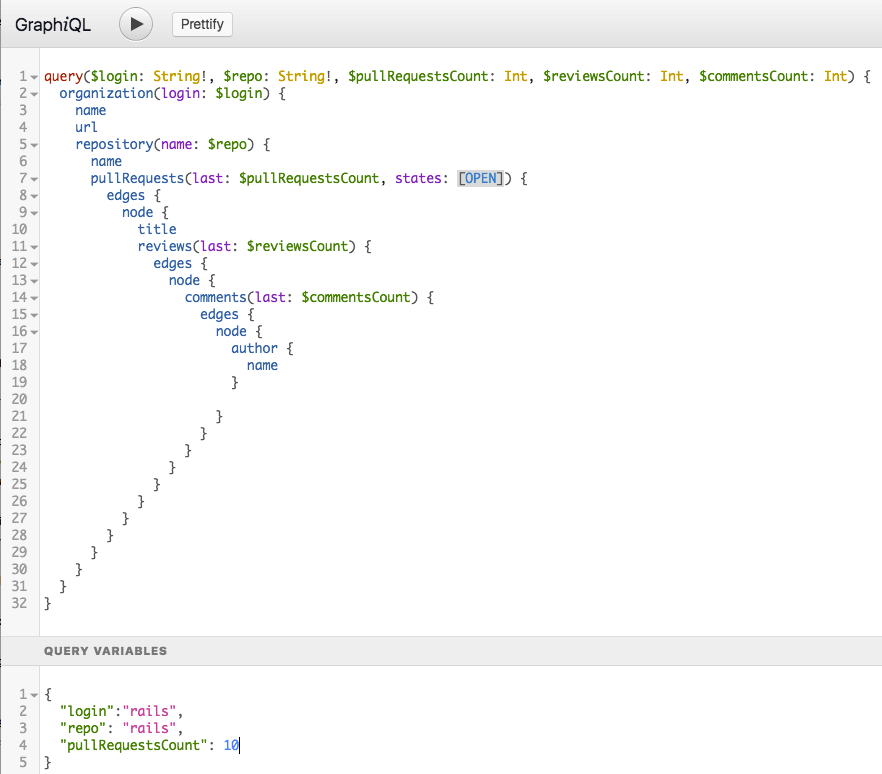
Rather than copying my screenshot, I'd suggest modifying the query yourself. If you make any errors, watch GraphQL present debug messages, helping you work through the query construction.
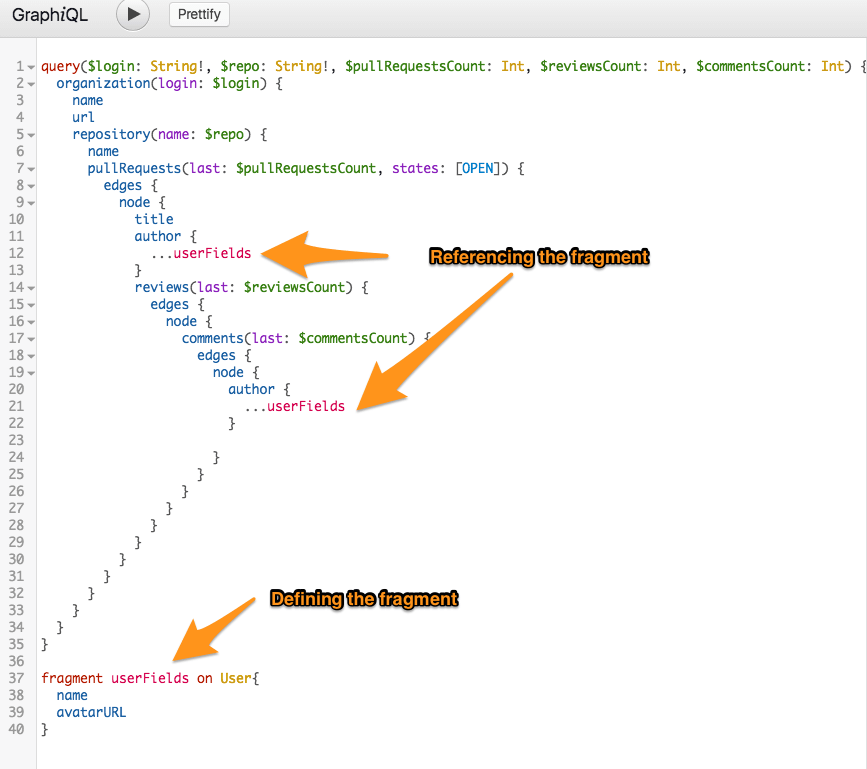
Fragments
Let's say I'd like to fetch each pull request author as well. We're already fetching user fields for each comment. Do I just copy and paste those fields?
LANG:code
author {
  name <-- User field
}
If you're like me, that feels non-DRY. We should ensure we grab the same data every time we fetch User fields. For example, if we decide to fetch an avatarUrl, we'd likely want to do that for every User.
GraphQL provides fragments for easy reuse. We can define a fragment for user fields:
LANG:code
fragment userFields on User{
  name
  avatarURL
}
...and include the fragment in our query.
Executing a GraphQL Query via Ruby
So far, I've just used GraphiQL to query the GitHub API. For real-world usage, I'll need to use a client library.
I'll use the Ruby graphql-client gem to execute the query and the terminal-table gem to display the leader board. I've created a GitHub repository with the needed bits to execute the query.
LANG:bash
git clone git@github.com:itsderek23/github_graphql.git
cd github_graphql
gem install terminal-table graphql-client
GITHUB_TOKEN=<your token> ruby github_graphql.rb
With this data, we can now build our pull request commenter leader board (full code):
+--------------------------+----------+ | Author | Comments | +--------------------------+----------+ | Rafael França | 23 | | Matthew Draper | 21 | | Jon Moss | 18 | | Kasper Timm Hansen | 14 | | Andrew White | 12 | | Sean Griffin | 10 | | Ryuta Kamizono | 10 | | Arthur Nogueira Neves | 7 | | Vladimir Dementyev | 7 | | Klas Eskilson | 6 | | Robin Dupret | 6 | | Bradley Priest | 6 | | kenta-s | 5 | | Kir Shatrov | 5 | | Nikolay Shebanov | 5 | | Koen Punt | 4 | | Egor Homakov | 4 | | David Faulkenberry | 4 | | Jeremy Daer | 4 | | Eileen M. Uchitelle | 4 | | Richard Beddington | 4 | | David Heinemeier Hansson | 4 | | Travis Hunter | 3 | | Nathan | 3 | | Guillermo Iguaran | 3 | | Mike Busch | 3 | | Alexander Marrs | 3 | | Mehmet Emin İNAÇ | 3 | +--------------------------+----------+
At this point, we've covered enough of the basics for you to explore building your first GraphQL query. There's certainly more to queries than what we've covered (directives, aliases, and more). See the official GraphQL website to learn more.