Editor's Note: This blog post has been updated since it was originally posted on July 17, 2019.
The methodologies surrounding Enterprise Java Deployment and Administration have changed over the last several years. In the following article, I talk about where we came from, where we’re going, and show you the data that I base my day-to-day evangelism upon. If you came here to find the Magic Java Virtual Machine (JVM) Arguments for Jenkins, you’ll find them here: Best Practices and The Magic JVM Arguments .
The JVM administrator role: Not all heroes wear capes
At some point in their careers, most DevOps engineers will have the pleasure of wearing the proverbial JVM Administrator hat. It’s a role that often gets assigned to our day-to-day responsibilities. It falls somewhere between ensuring that the server room doesn’t catch fire and responding to the 50 emails about a broken Python script that automates the coffee machine.
Because the JVM Administrator role is just a slice of the pie-chart of tasks we as DevOps Engineers humbly accept, its weight and importance to the overall success of a project can often become undervalued. I know this all too well. I’ve scrambled into the witching hours, nearing a project deadline, surrounded by cans of Mountain Dew and boxes of cold pizza, trying to interpret a mix of vendor and Oracle documentation to spin up a new cluster of JVM’s using minimal settings, praying it doesn’t take down the already under-resourced cluster of virtual machines all while following a strict set of guidelines that state: “Fit Square Peg into Round Hole.”
Admittedly, I was too busy putting out the fire du jour and didn’t understand how important JVM tuning was to give it the respect it deserves. This kind of reactive vs. proactive approach to Enterprise Java Deployment is more common than many realize. While developers who use Java inherently know that Java bytecode runs in a JRE (Java Runtime Environment), the often-overlooked events that are critical to application performance take place in the JVM.
It’s arguable that most Java developers don’t really need to know how the JVM works. I once read in a slide used during a JVM training that of the 8 million+ Java developers out there, it’s estimated that less than 5% of them understand the inner-workings of the JVM. While I have yet to see an actual citation on that statistic -- I imagine it’s similar to a Family Feud Poll, “We asked a hundred Java Developers if they knew how Garbage Collection works -- if it’s true, if not the developers, then whose responsibility is it to really understand this stuff?
You guessed it. The JVM Administrator, and yes, it’s a real role.
Historical JVM administration: How we got here
The year is 2012, and while it did not bring about the literal end of the world as the Mayans predicted, Facebook still went public, and if you were working with Java, you were probably already working with, or desperately trying to move to JDK 1.7.
At that point in my career, I was working in the media industry, tasked with installing and supporting hundreds of installations of my company’s Java application. If our platform was down, then end-users quite literally had no fallback and couldn’t deliver their work. Phones would ring, people would scream, and we would fight the fires. Uptime for the application was imperative, and moving to a high availability cloud solution wasn’t a realistic option back then. Big media wasn’t ready for the cloud for a multitude of reasons, bandwidth and cost being the top two.
During this time, system admins like myself would casually stumble across blog posts looking for new and exciting JVM Arguments to introduce that could save us a few seconds here and there, improve application performance and ultimately the user experience. It was common knowledge that the JVM needed three things in order to function: CPU, RAM, and disk space. When the JVM ran out of memory, you added more. If you had no more to give, you had to state your case to the boss on why you needed a few hundred bucks for more RAM sticks.
This was common practice. Feed the JVM more resources. Problem solved…or not.
The problem with this antiquated way of thinking is that you wind up with monolithic applications. JVM Heap Sizes that are so massive, the Garbage Collection cycles alone are enough for you to break from your console and grab a cup of coffee.
If I take the trash out from my office, it takes me a few minutes to walk it to the dumpster, and then I’m back at my desk relatively quickly. When the garbage truck comes and takes the dumpster load to the landfill, this is going to be more involved, and take significantly more time. The same concept applies to the JVM. The larger your heap size, the more objects marked for garbage need to be collected.
Magic is real - garbage collector voodoo
So, why is this a problem? Flash forward to present day, we are no longer using JDK 1.7, nor are we dealing with concepts like PermGen space. In fact, as of Java 1.7, PermGen space, which is where your classes, thread stacks and garbage collection among other things take place, was a finitely defined amount of memory. With Java 1.8, the concept of PermGen space was replaced with Metaspace. The big difference between the two was that Metaspace has no default limitation, and can grow unbounded.
This placed a renewed focus on Garbage Collection, and the different collectors offered by JDK 1.8. In many conversations I’ve had over the years, the topic of Garbage Collection is typically brushed off as algorithmic voodoo science. While this may be true, I’m here to tell you, magic is real, and there are wizards out there ensuring these algorithms are performing and stable to make life easier for everyone. I would encourage you to explore the limited resources on the topic, and in doing so you’ll find that Richard Jones’s Garbage Collection Handbook , written more than two decades ago, is still the authority on the topic.
The important thing to remember about a Garbage Collection cycle is that it is a stop-the-world event. This means that during runtime, no other threads will execute until the GC cycle is complete. Ever wonder why your application feels sluggish, or perhaps your login is taking a long time? It’s very possible you are suffering from a poorly tuned GC cycle which is affecting all end-users of the application.
Ultimately, the different behaviors of the modern-day garbage collectors come heavily into play when weighing which one to use with your application. Most system admins were hesitant to explore experimental garbage collectors like G1 during the JDK 1.7 days because although it was technically supported, there wasn’t enough data that came out to prove it’s superiority to say, Concurrent Mark Sweep (CMS). I certainly wasn’t going to use G1 in a production environment as, quite frankly, it was too new and likely too buggy. Additionally, what may work for App A, may not be the best choice for App B. The most important takeaway here is that as the JVM Administrator, you should thoroughly test any changes to the default JVM Arguments bundled with JVM, including the selection of an alternate garbage collector.
As of JDK 1.8, If you are using a 4GB+ heap size, and your application has a low latency and high throughput requirement, then using the G1GC collector, is the right choice. It’s just as important to ensure your JDK is up-to-date to take advantage of the litany of bug and memory-leak fixes as well as improvements to the G1GC algorithm. As of Java 9, it became the default Garbage Collector.
JVM Arguments: KISS
You’ve probably heard of the KISS principle, associated with Aeronautical Engineer Kelly Johnson who designed the SR-71 BlackBird in his secret “Skunk Works” project of modern legend. It states that most systems work best if they are kept simple rather than made complex; therefore simplicity should be a key goal in design, and unnecessary complexity should be avoided. While this may seem like a stretch in the context of designing spy planes vs systems administration, the fundamental ideology, in my opinion, is quite sound.
When you think about the reasons for implementing additional JVM Arguments outside of the default, it is important to remember that each argument may produce unexpected overhead. Furthermore, complex tuning of your garbage collector by using percentages or values that are outside of the default is effectively stating you are attempting to be smarter than the algorithm. The keyword there is “attempting.”
There are a lot of whitepapers floating around stating to use `-XXNewFancyArgument` because of the data presented. Remember, your application may not be the application that was performance tested in the whitepaper. Every JVM Argument you add should be scrutinized, and more importantly, you should understand exactly what it does, and thoroughly test any change you introduce into your environment.
Scale before you fail: Where we are going
The aforementioned monolithic application way of thinking gave way in recent years to concepts like horizontal scaling and ephemerality, much in part to the adoption of highly available Cloud services and the broader acceptance of technologies like Docker and Kubernetes.
A while back when publishing the JVM Tuning Recommendations for Jenkins , I documented our current best practices around Java 8, thanks to previous baseline analysis , as well as real-world implementation, and found that assuming your host has 32 GB of RAM, limiting heap sizes to 16GB is the best practice. It serves as an indicative demarcation that it is time to horizontally scale the application. This was determined by performance testing the application under load, and studying the behavior of GC logs, thread dumps, and heap dumps, which provide us metrics we would not see by only looking at resource consumption.
Ideally, in a containerized environment, I’d recommend an even smaller heap size, and follow the methodology of a microservices architecture. Finding what works best for your application is ultimately the result of baselining, performance testing and analysis.
Why can’t I go to 24GB heap size, you ask? You can. You are the JVM Administrator, and technically you can do whatever you want within reason. However, as you grow your heap size, remember that you still have to allow for Metaspace, as well as resources for the operating system. While the default max heap size is ¼ of physical memory, most JVM’s I’ve encountered are “safe” to use up to ½. By continuing to increase your heap size, stop and ask yourself if it would serve you better over the long term to scale horizontally provided your application allows for it. While the path of least resistance is to increase resources, you may be inadvertently lighting a fuse.
Jenkins stability and performance
Jenkins is the dominant CI/CD automation server and heavily relied on by development teams around the world. Because of this, uptime and performance is a hot topic. As a CloudBees Developer Support Engineer, I speak with my clients every day about the points I’ve covered above, especially when troubleshooting performance issues. Because Jenkins is an Enterprise Java Application, most of the performance issues I troubleshoot can be remedied by analyzing three things:
-
Garbage Collection Logs
-
Thread Dumps
-
Heap Dumps
The number one root cause of performance issues with Jenkins is not following our documented Best Practices.
Below are some examples of analysis we’ve done showing the before and after Key Performance Indicators (KPIs) of throughput and latency at Fortune 100 companies using the methodologies I’ve described.
Real-world data from big bank
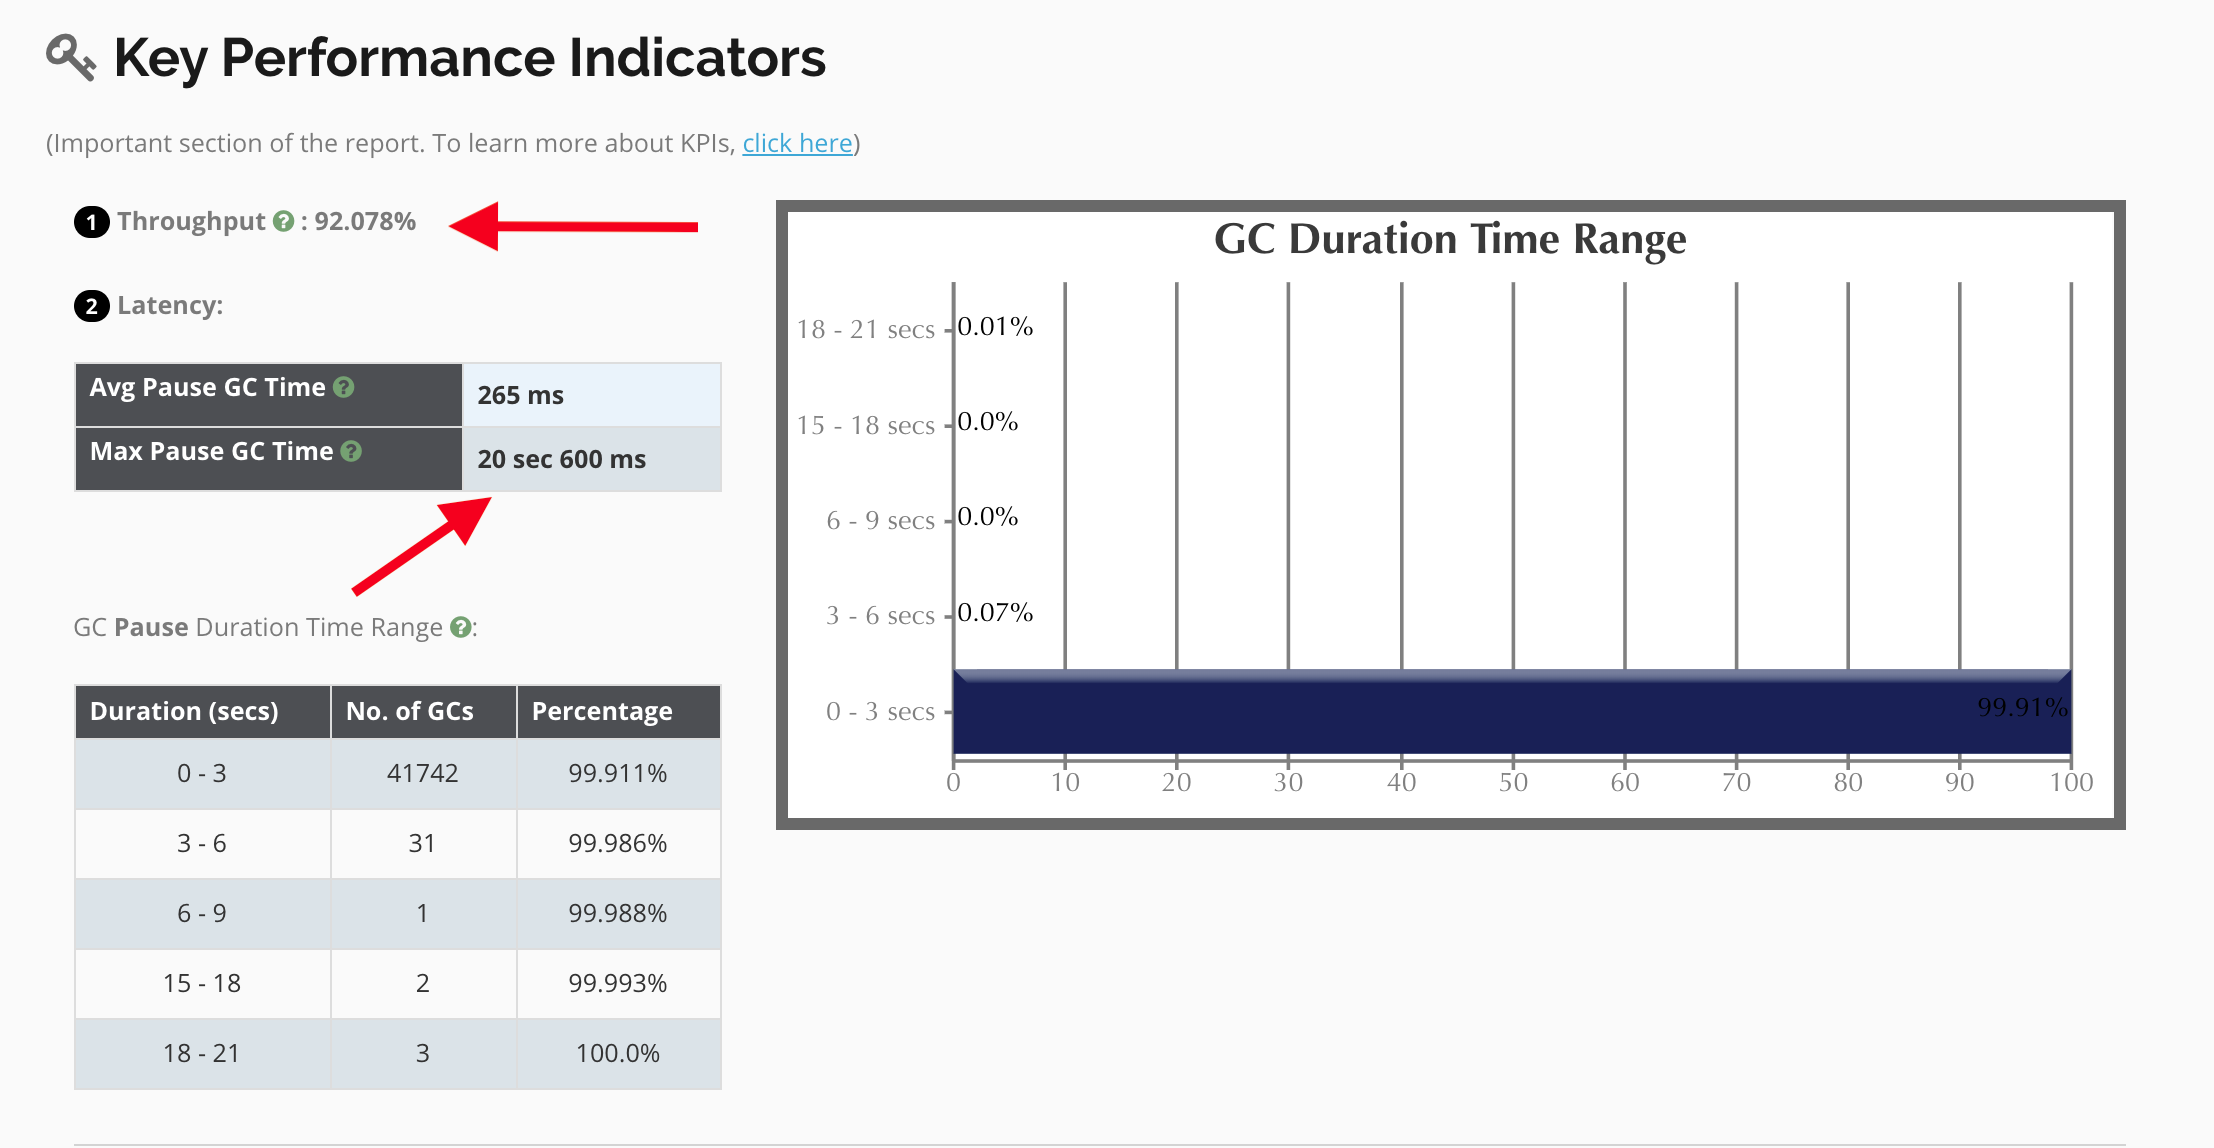
Scenario: It was reported that users were waiting several minutes to log in to the application and UI navigation was painfully slow. Looking at the GC data, the following KPIs were observed:
Application Throughput
Note that the application throughput is at ~92%. This means that about ~8% of the time, the application is waiting for Garbage Collection! Remember, these are stop-the-world events, so during this time no other threads are moving, including login and http requests. Ultimately, this is causing a bottleneck that will eventually render the application unusable. We aim to keep a healthy throughput at ~99%.
Max Pause GC Time
Note that there are +20s wait times! This explains the UI slowness reported, as well as the thread bottlenecks this is causing. Because Jenkins is a Java application that requires low latency, we want to ideally see this number <1s.
Heap Usage (After GC)
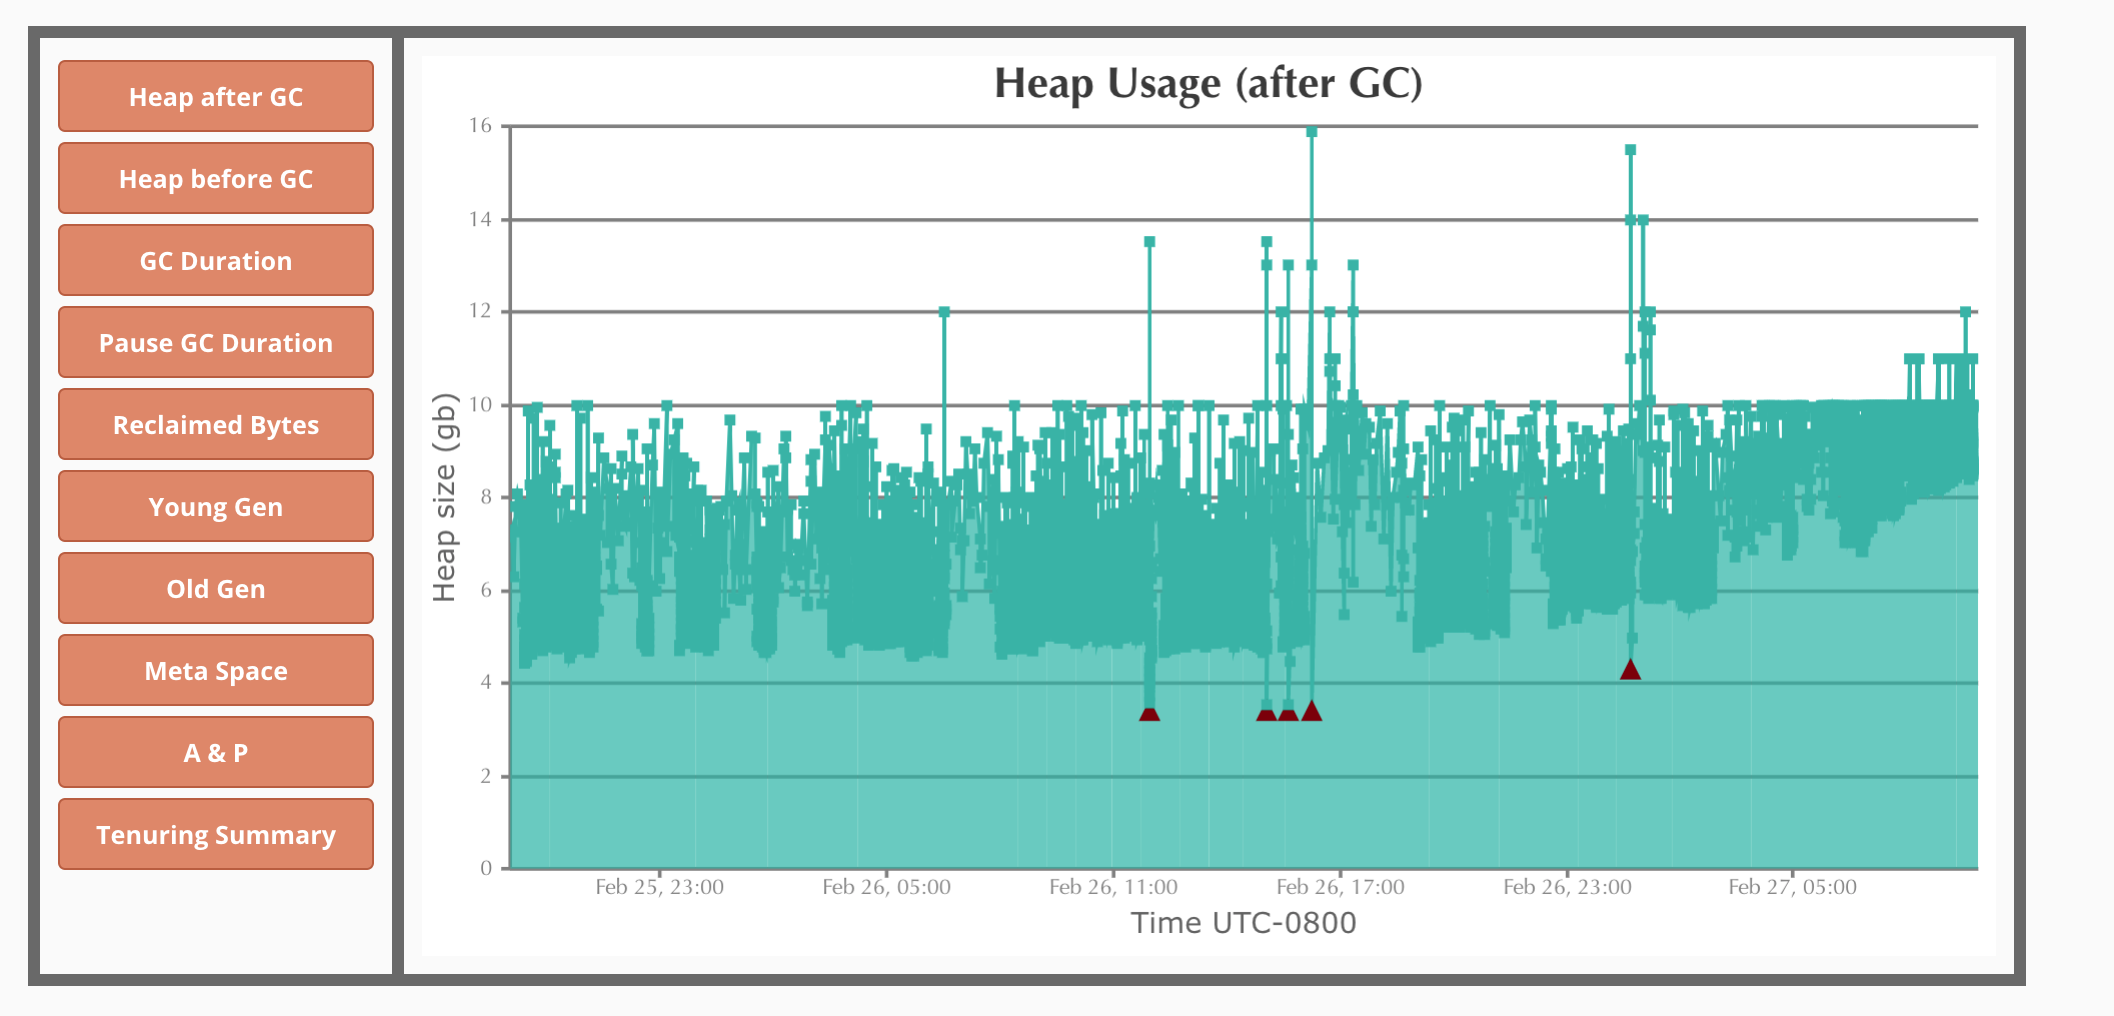
Using our internal Enterprise GCEasy/ analyzer, we can see the heap utilization is constant. Note that in this 72 hour period there were ~42,000+ GC Cycles. After an analysis of the JVM arguments in place, it was found that several arguments were forcing the G1 Algorithm to work overtime to keep within the constraints of the argument limitations. Examples of unwanted arguments:
-XX:-UseAdaptiveSizePolicy
-XX:G1NewSizePercent=20
-XX:MaxMetaspaceExpansion=64M
-XX:G1SummarizeRSetStatsPeriod=1
-XX:G1HeapRegionSize=4m
-XX:MetaspaceSize=1024m
-XX:MaxMetaspaceSize=2048m
All of those arguments have overhead to the JVM and force the Garbage Collector to work outside of its default algorithms. Removing these arguments was recommended and ultimately led to a resolution.
Resolution : Once the unwanted JVM Arguments were removed, the following KPIs were observed:
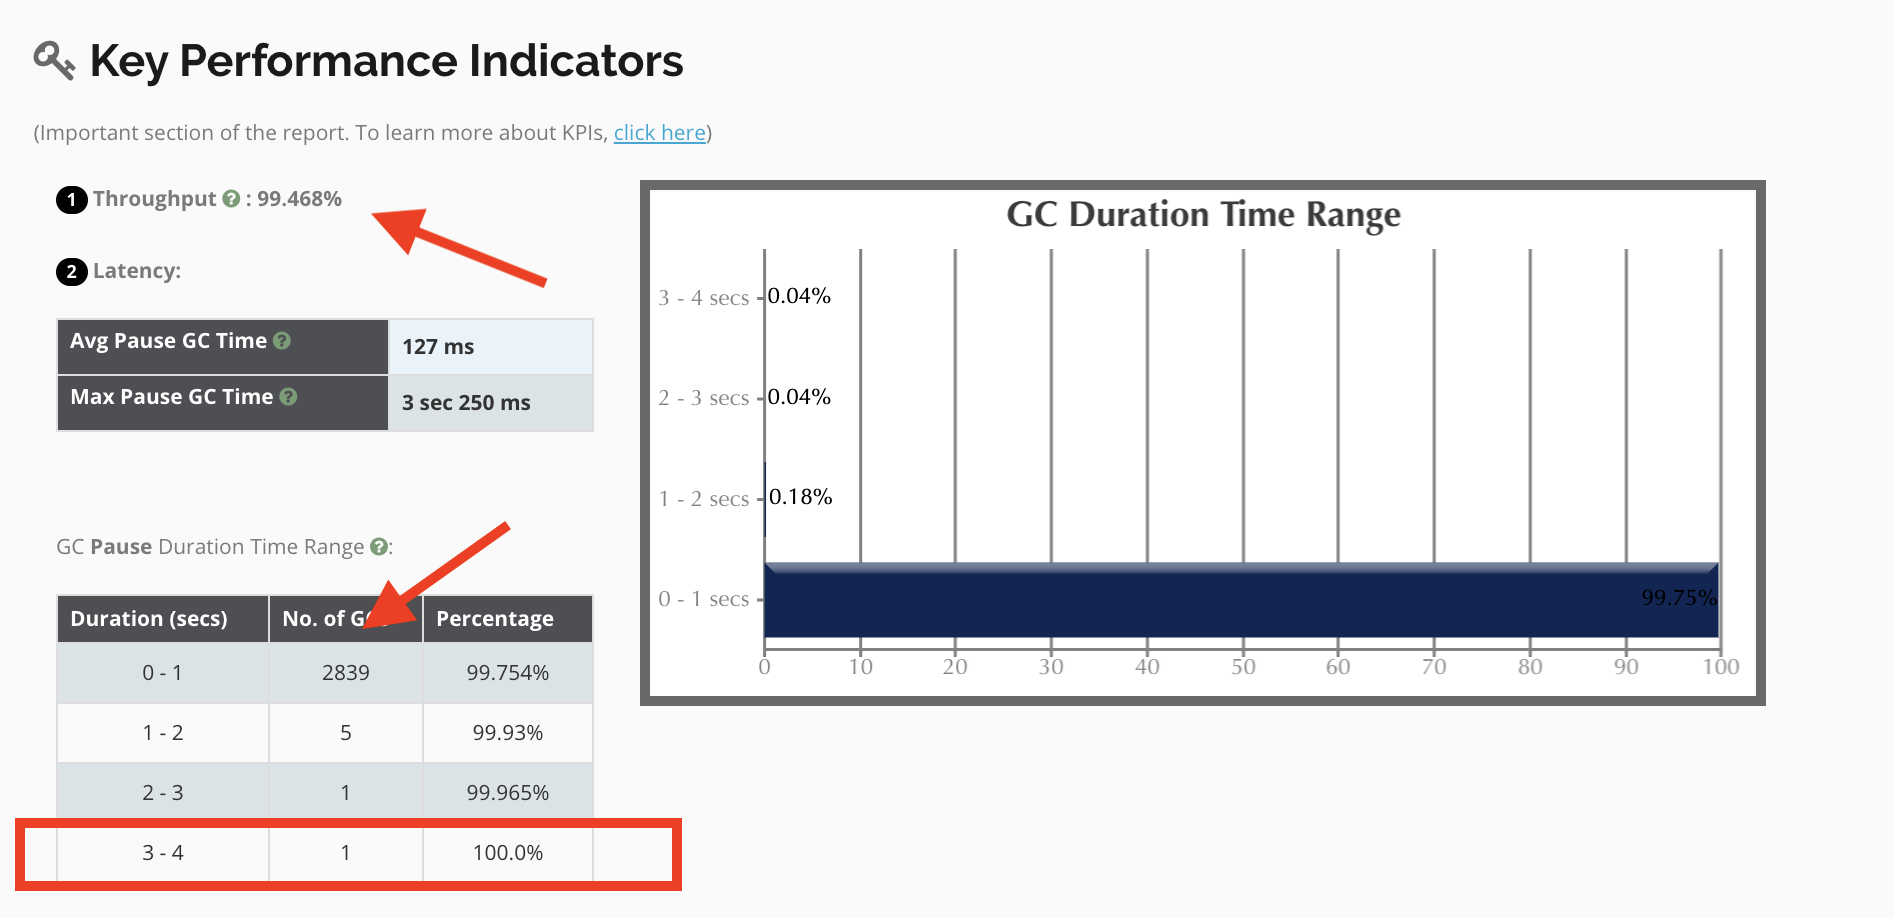
Application Throughput
We went from ~92% to 99%. This is huge! Note that the number of GC Cycles was also cut dramatically. Where we were seeing ~42,000 cycles before, we now see ~2800.
Max Pause GC Time
Note that where there were +20s wait times we are now seeing 1 event take 3 seconds, and the average time was cut 50% from 265ms to 127ms.
Removing the JVM Arguments that were causing overhead ultimately allowed the GC Algorithm to do what it was intended to do without having to operate with a wrench in its cogs.
Real-world data from big shipping
Scenario: It was reported that HA Failover was occurring daily, leading to multiple production outages and downtime for Jenkins users. Looking at the GC Data, the following was observed:
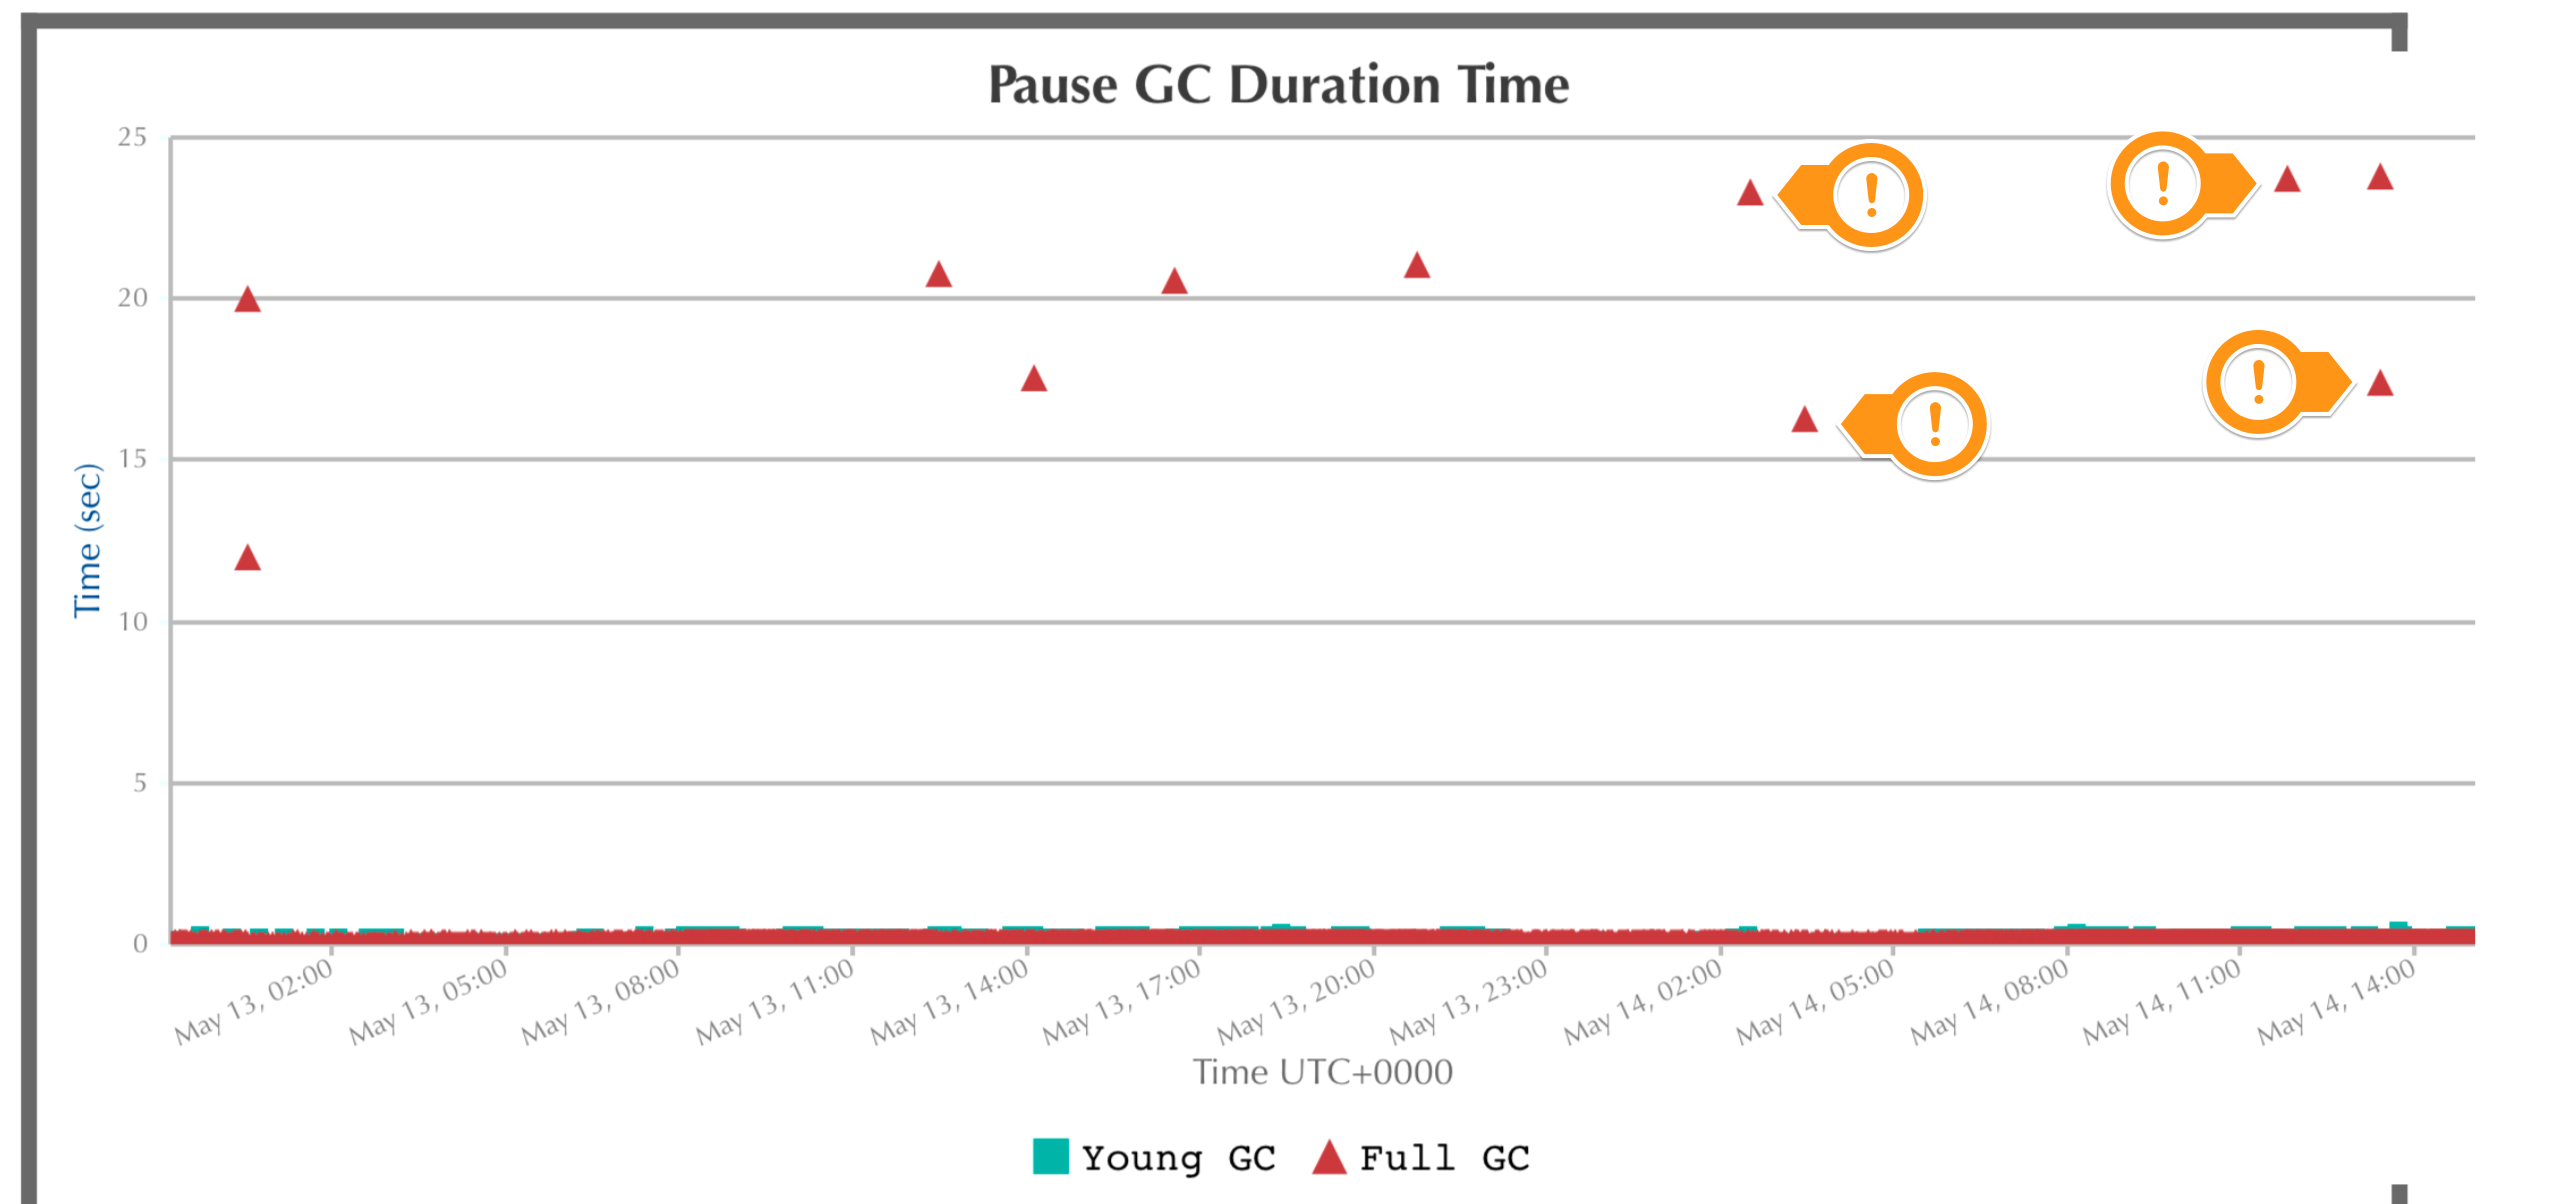
Pause GC Duration Time
We can clearly see that GC pauses over the course of a week ranged from 12 to 23s which is longer than the 10s High Availability Failover setting, thus being the root cause of the failovers. It was noted that the following JVM Arguments were being set and it was recommended to remove them:
-XX:G1NewSizePercent=20
-XX:MaxMetaspaceExpansion=64M
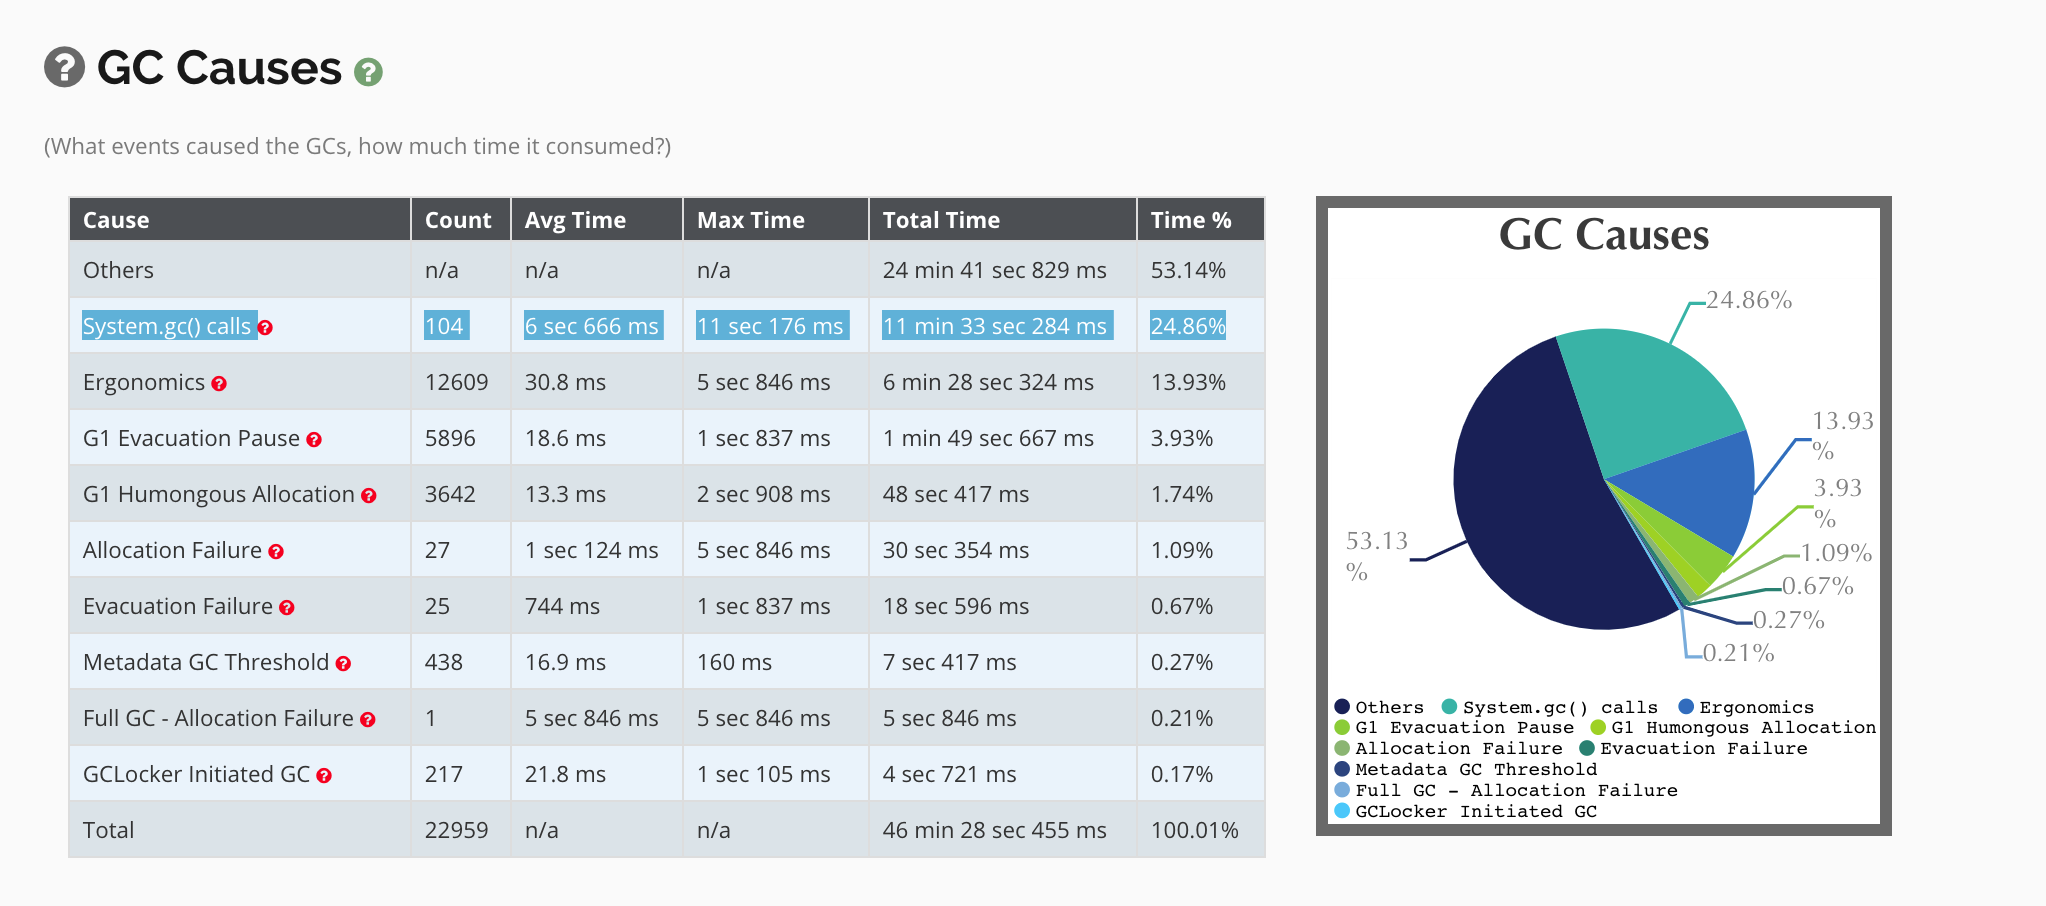
System.gc() Calls
While the Jenkins codebase does not contain system.gc() method calls as a best practice, due to the over 4K plugins available for Jenkins, sometimes a plugin developer will use this method. Intentionally or not, at a high level, it is indicative that the developer is trying to be smarter than the GC algorithm. This is like throwing a wrench into the cogs of the natural GC cycle. Here we can see that 11s pause times are occurring, which happens to be longer than the 10s High Availability Failover setting. In this case the addition of the -XX:+DisableExplicitGC JVM Argument resolved this issue.
Resolution : Once the unwanted JVM Arguments were removed, and the best practices were implemented, the following KPIs were observed:
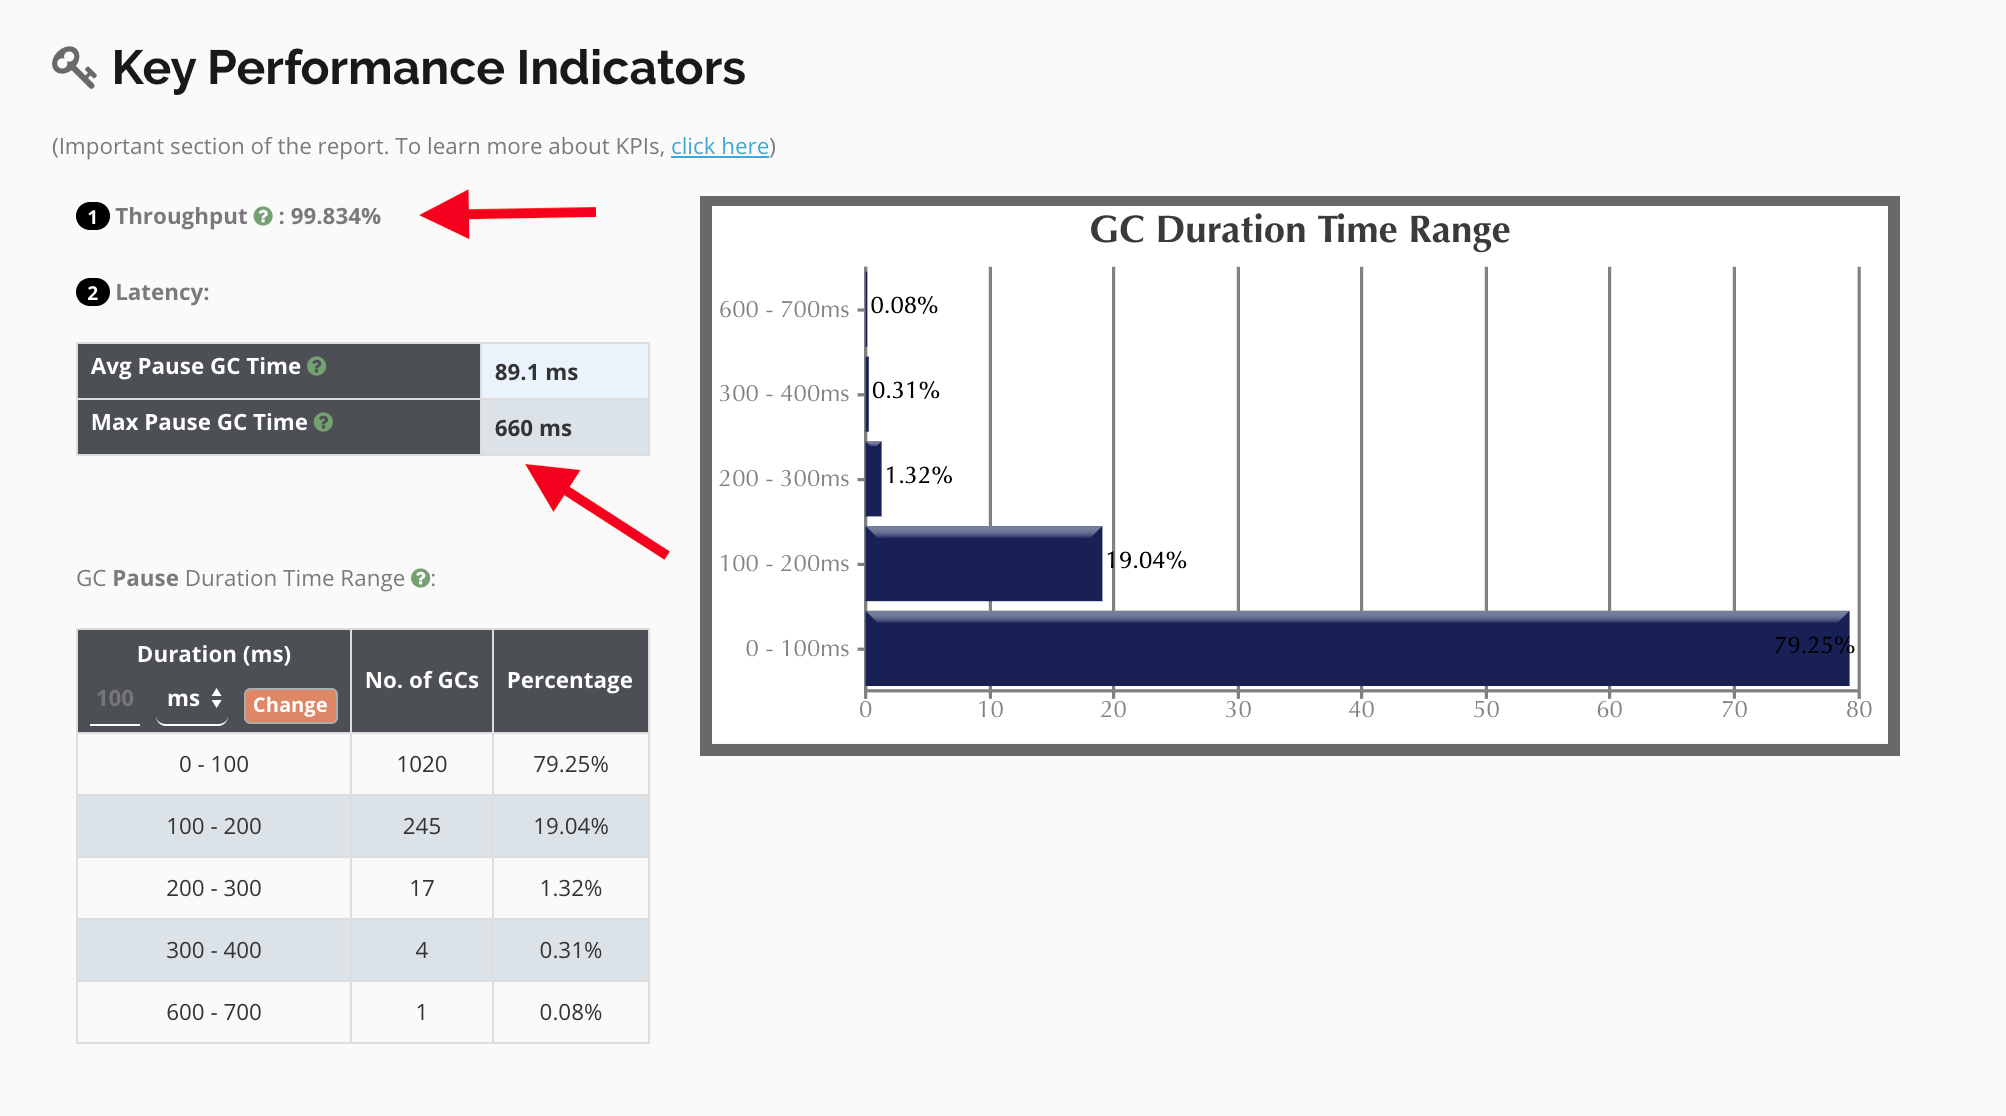
Application Throughput
An amazing output of 99%! All from changing the JVM Arguments to use our recommended best practices!
Max Pause GC Time
We saw a drop from 12-23 second pauses to a max time of 660ms with an average of 89.1ms!! This is a 3500% increase in performance!
A future so bright you gotta wear shades
I could post more data here as countless examples that further prove the methodologies I've outlined, but I strongly encourage you to employ your own testing and see for yourself the increases in performance and stability. Historically, we as administrators have been focused on CPU, RAM, and IO utilization of our Java applications, and while they still remain incredibly important, there is much more valuable information that can be gathered by exploring your GC logs, Thread Dumps, and Heap Dumps of the application.
As always, feel free to reach out to support@cloudbees.com if you have any questions!
